. 2025 Aug;603(16):4659-4679.
doi: 10.1113/JP288073. Epub 2025 Jul 28.

State-dependent neural representations of muscle synergies in the spinal cord revealed by optogenetic stimulation

Affiliations

State-dependent neural representations of muscle synergies in the spinal cord revealed by optogenetic stimulation

Borong He et al. J Physiol. 2025 Aug.

Abstract

The central nervous system controls movement by combining neuromotor modules, known as muscle synergies. Previous studies suggest that spinal premotor interneurons (PreM-INs) contribute to the encoding of stable muscle synergies for voluntary movement. But descending and sensory inputs also influence motor outputs through the spinal interneuronal network, which may be configured by its inputs to encode different sets of muscle synergies depending on the network state, thereby recruiting different selections of synergies. Here we tested this possibility of state-dependent synergy encoding by examining the muscle synergies represented by the same upstream spinal interneurons under different activity states induced by various optogenetic stimulation patterns. Lumbosacral spinal units and electromyographic (EMG) activities of hindlimb muscles were simultaneously recorded from anaesthetized Thy1-ChR2 mice as the spinal cord was stimulated by one or two optic fibres at different intensities. The synergy encoded by each unit was revealed as a 'muscle field' derived from spike-triggered averages of EMG, whereas the entire muscle synergy set was factorized from the EMG. We found that although the muscle synergy set remained stable across stimulation conditions, the muscle fields of the same units were matched to different synergies within the set in different states. Thus the interneurons may flexibly adjust their connectivity with the motoneurons of the muscles as descending and sensory afferents impose different states on the spinal network. State-dependent encoding of muscle synergies may allow different synergies to be selected for producing stable movement in an ever-changing workspace environment. KEY POINTS: Muscle synergies for locomotion can be represented by spinal interneurons, as revealed by the interneurons' muscle fields derived from spike-triggered averages of EMG. The muscle field of a single spinal interneuron may vary under different stimulation conditions, as demonstrated by optogenetic stimulation. Encoding of muscle synergies is dependent on the state of spinal activities, thus facilitating the selection of appropriate synergies in different dynamic environments.

Keywords: electrophysiology; locomotion; muscle activity; muscle synergies; optogenetic stimulation; spinal cord.


Conflict of interest statement

The authors declare no competing interests.

Figures

Figure 1
Figure 1. Experimental set‐up.
A, neural and muscle activities were elicited by optogenetic stimulation while the mouse was under anaesthesia. The two carbon nanotube fibre (CNTF) electrodes were typically inserted into L2 and/or L3 spinal segments, ipsilateral to the implanted muscles. B, a CNTF electrode, coloured in orange and whose length is marked by triangles, along with its connector (16‐channel Samtec attached to ZIF‐Clip) on the right. C, a histological slice of the spinal cord showing the electrode's route of penetration (marked by red arrows). The CNTF electrode was inserted into the spinal cord from the dorsal surface of the cord. Neurons with Thy1‐ChR2 expression were labelled green. [Colour figure can be viewed at wileyonlinelibrary.com]
Figure 2
Figure 2. Muscle fields of interneuronal units could be matched to EMG‐derived muscle synergies.
A, raw spikes of two units and raw EMG activities of six hindlimb muscles, temporally aligned with the optogenetic stimulation that elicited them. Data from three trials of the same spinal stimulation locus are shown. B, two‐dimensional distribution of peak width at half maximum (PWHM) (mean ± SD: 19.6 ± 4.1 ms) and onset latency (mean ± SD: −0.4 ± 4 ms) of post‐spike facilitations from all recorded spinal interneurons (13 units from 9 mice). C, the muscle field (in red) retrieved by spike‐triggered averages (SpTA) could be well matched to one of the EMG‐derived preferred muscle synergies W1 (blue). The other two synergies W2 and W3 (grey) could not be well matched to this specific muscle field. The pairwise scalar product value between the muscle field and each synergy is shown at the bottom of the synergy. D, the pairwise similarity between the muscle fields and muscle synergies for the preferred pairs (N = 13) is significantly higher than those for the non‐preferred pairs (N = 38) (unpaired t test, P < 0.0001). The error bars represent the minimum and maximum values of the data. [Colour figure can be viewed at wileyonlinelibrary.com]
Figure 3
Figure 3. Muscle synergies from different clusters could be matched to muscle fields of different upstream interneurons.
This figure displays nine clusters of muscle synergies, with the horizontal bars representing either muscle synergies or the muscle fields matched to the synergies. Muscle synergies that are best matched to a muscle field are shown in blue, while their corresponding muscle fields are shown in red. Muscle synergies not matched to any muscle field are depicted in grey. On top of each muscle synergy or muscle field vector, the vector's corresponding mouse number and a preference indicator are provided: indicator ‘p’ indicates that the synergy was preferentially paired with the muscle field, while indicator ‘n’ indicates that the synergy was not paired with any recorded muscle field. The number of synergy clusters (n = 9) was identified based on the number that yielded the highest silhouette value, as shown in the plot at the bottom right (C = 9, S = 0.72). [Colour figure can be viewed at wileyonlinelibrary.com]
Figure 4
Figure 4. Pairwise similarity between muscle fields and muscle synergies, between muscle synergies of different conditions and between muscle fields of different conditions (single‐fibre stimulation at threshold power (SST), single‐fibre stimulation at above‐threshold power (SSAT) and co‐stimulation at threshold power (CoST)).
A, an example showing how the muscle field of a unit (unit 1, red) changed from SST to SSAT even though a muscle synergy from each condition (synergy S4 in SST, S2 in SSAT; blue) could still be well matched to the unit's muscle field in that same condition. The similarity value is indicated at the bottom of the synergy bar. B, analogous to (A), muscle field of unit 2 (red) changed from SST to CoST, but a synergy could still be well matched to the muscle field of both conditions despite the change. C, pairwise similarity between muscle synergies of SST and SSAT is significantly higher than that between muscle fields of SST and SSAT (unpaired t test, P = 0.0415, dF = 10, tstat = 2.3372), as shown by the black bars. Similarities between muscle fields and synergies in SST (or SSAT) are shown in blue (or red). ‘Best‐match pairs’ refer to the pairings of muscle fields with their corresponding preferred synergies, and ‘unmatch pairs’ refer to the pairings of muscle fields with the rest of the synergies (non‐preferred synergies). Both the within‐condition similarity of the best‐matched field‐synergy pairs in SST and that in SSAT are significantly higher than the across‐condition similarity between the muscle fields of the two conditions (unpaired t test: P = 0.0188, dF = 12, tstat = 2.7157; P = 0.0570, dF = 11, tstat = 2.1259). D, analogous to (C), but showing data for the SST vs. CoST comparison (unpaired t test: P = 0.0046, dF = 12, tstat = 3.4793; P = 0.0174, dF = 12, tstat = 2.7556). [Colour figure can be viewed at wileyonlinelibrary.com]
Figure 5
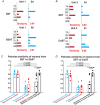
Figure 5. Changes in muscle fields explained by three forms of modifications of the preferred muscle synergies.
A, muscle fields of unit 1 in single‐fibre stimulation at threshold power (SST) and single‐fibre stimulation at above‐threshold power (SSAT) could be well matched to the preferred synergy S1SST and S3SSAT, respectively. Form 1: merging (‘M’) – The altered muscle field of unit 1 in SSAT can be explained by merging preferred synergies S1SST and an additional synergy S3SST, resulting in preferred S3SSAT. B, form 2: unmatched (‘U’) – muscle fields of unit 1 were matched to two distinct synergies, S4SST and S3SSAT in SST and SSAT, respectively. C, form 3: preserved (‘P’) – muscle fields of unit 1 were matched to two similar synergies, S3SST in SST and S2SSAT in SSAT. D, the prevalences of the three forms of modification differed between transitions from SST to SSAT and from SST to CoST. Form 1 (merging) dominated in the SST‐to‐SSAT transition. Form 2 (unmatched) dominated in the SST‐to‐CoST transition. [Colour figure can be viewed at wileyonlinelibrary.com]
Figure 6
Figure 6. Correlation between firing rates and synergy activities.
A, four synergies were extracted from EMGs concatenated from the recordings of all stimulation loci of ‘mouse_19_12’. B, the trial‐averaged neural firing rate of a unit from the same mouse in (A) (F. R, shown in red) is plotted across the stimulated spinal loci from rostral to caudal. Below the amplitudes of trial‐averaged synergy activities for the four synergies (C1–C4, shown in blue) across the same spinal loci are displayed. The correlation coefficient between the neural firing rate and the synergy activity for each pair is indicated to the right of each axis. C, linear correlation between the averaged neural firing rate and the amplitude of corresponding activation coefficient (Ccorres) of the preferred synergy (t‐statistic: P = 0.123, Rsq = 0.025, dF = 96). D, linear correlation between the averaged firing rate and the amplitude of the activation coefficient with maximum correlation coefficient value (Cprefer) (t‐statistic: P = 0.00633, Rsq = 0.075, dF = 96). [Colour figure can be viewed at wileyonlinelibrary.com]
Figure 7
Figure 7. Hypothetical connectivity patterns between the spinal interneurons and the motoneuronal pools that may account for state‐dependent synergy encoding of the upstream spinal interneurons.
A, threshold stimulation (single‐fibre stimulation at threshold power (SST)): N1 represents the neuron stimulated directly by the laser beam during the recording trial. N3 is the neuron recorded by the carbon nanotube fibre (CNTF) electrode. The black arrows indicate the connectivity between N3, premotor interneurons (PreM‐IN) and the motoneuronal pools of the muscles. Here PreM‐INα, activated by N3, in turn co‐ordinates a muscle synergy consisting of muscles M2 to M4. B, at above‐threshold stimulation (SSAT), the ‘merging’ synergy modification form (form 1) dominates. Here a neighbouring excitatory premotor interneuron PreM‐INβ and an inhibitory premotor interneuron PreM‐INγ are recruited as a result of stronger activations of N1 (and hence, N3). The combined effect of these additional recruitments leads to the merging (i.e. linear combination) of the synergies originally encoded by PreM‐INα, PreM‐INβ and PreM‐INγ. C, in co‐stimulation (CoST), modification form 2 (‘unmatched’) dominates. Here N1 and N5 represent the neurons co‐stimulated by the two laser fibres, and PreM‐INθ is an inhibitory premotor interneuron that inhibits muscle M2. As a result of such co‐stimulation a distinct muscle coactivation pattern (M3 and M4) is associated with the recorded N3. This new pattern can also typically be retrieved by activating N6. [Colour figure can be viewed at wileyonlinelibrary.com]

Similar articles

References

    1. Ashe, J. , & Georgopoulos, A. P. (1994). Movement parameters and neural activity in motor cortex and area 5. Cerebral Cortex, 4(6), 590–600. - PubMed
    1. Baggen, R. J. , van Dieën, J. H. , van Roie, E. , Verschueren, S. M. , Giarmatzis, G. , Delecluse, C. , & Dominici, N. (2020). Age‐related differences in muscle synergy organization during step ascent at different heights and directions. Applied Sciences, 10(6), 1987.
    1. Berger, D. J. , & d'Avella, A. (2023). Persistent changes in motor adaptation strategies after perturbations that require exploration of novel muscle activation patterns. Journal of Neurophysiology, 130(5), 1194–1199. - PubMed
    1. Berger, D. J. , Gentner, R. , Edmunds, T. , Pai, D. K. , & d'Avella, A. (2013). Differences in adaptation rates after virtual surgeries provide direct evidence for modularity. Journal of Neuroscience, 33(30), 12384–12394. - PMC - PubMed
    1. Bizzi, E. , Mussa‐Ivaldi, F. , & Giszter, S. (1991). Computations underlying the execution of movement: A biological perspective. Science, 253(5017), 287–291. - PubMed

LinkOut - more resources