Use of imaging biomarkers and ambulatory functional endpoints in Duchenne muscular dystrophy clinical trials: Systematic review and machine learning-driven trend analysis
- PMID: 40726385
- PMCID: PMC12330827
- DOI: 10.1177/22143602251360664
Use of imaging biomarkers and ambulatory functional endpoints in Duchenne muscular dystrophy clinical trials: Systematic review and machine learning-driven trend analysis
Abstract
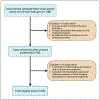
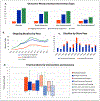
Duchenne muscular dystrophy (DMD) is a rare X-linked genetic muscle disorder affecting primarily pediatric males and leading to limited life expectancy. This systematic review of 85 DMD trials and non-interventional studies (2010-2022) evaluated how magnetic resonance imaging biomarkers-particularly fat fraction and T2 relaxation time-are currently being used to quantitatively track disease progression and how their use compares to traditional mobility-based functional endpoints. Imaging biomarker studies lasted on average 4.50 years, approximately 11 months longer than those using only ambulatory functional endpoints. While 93% of biologic intervention trials (n = 28) included ambulatory functional endpoints, only 13.3% (n = 4) incorporated imaging biomarkers. Small molecule trials and natural history studies were the predominant contributors to imaging biomarker use, each comprising 30.4% of such studies. Small molecule trials used imaging biomarkers more frequently than biologic trials, likely because biologics often target dystrophin, an established surrogate biomarker, while small molecules lack regulatory-approved biomarkers. Notably, following the 2018 FDA guidance finalization, we observed a significant decrease in new trials using imaging biomarkers despite earlier regulatory encouragement. This analysis demonstrates that while imaging biomarkers are increasingly used in natural history studies, their integration into interventional trials remains limited. From XGBoost machine learning analysis, trial duration and start year were the strongest predictors of biomarker usage, with a decline observed following the 2018 FDA guidance. Despite their potential to objectively track disease progression, imaging biomarkers have not yet been widely adopted as primary endpoints in therapeutic trials, likely due to regulatory and logistical challenges. Future research should examine whether standardizing imaging protocols or integrating hybrid endpoint models could bridge the regulatory gap currently limiting biomarker adoption in therapeutic trials.
Keywords: Duchenne muscular dystrophy; and machine learning; clinical trials; functional endpoints; imaging biomarkers; rare diseases; systematic review; trend analysis.
Conflict of interest statement
Declaration of conflicting interests
The author(s) declared no potential conflicts of interest with respect to the research, authorship, and/or publication of this article.
Figures


Similar articles
-
The Black Book of Psychotropic Dosing and Monitoring.Psychopharmacol Bull. 2024 Jul 8;54(3):8-59. Psychopharmacol Bull. 2024. PMID: 38993656 Free PMC article. Review.
-
Corticosteroids for the treatment of Duchenne muscular dystrophy.Cochrane Database Syst Rev. 2016 May 5;2016(5):CD003725. doi: 10.1002/14651858.CD003725.pub4. Cochrane Database Syst Rev. 2016. PMID: 27149418 Free PMC article.
-
A rapid and systematic review of the clinical effectiveness and cost-effectiveness of paclitaxel, docetaxel, gemcitabine and vinorelbine in non-small-cell lung cancer.Health Technol Assess. 2001;5(32):1-195. doi: 10.3310/hta5320. Health Technol Assess. 2001. PMID: 12065068
-
Systemic pharmacological treatments for chronic plaque psoriasis: a network meta-analysis.Cochrane Database Syst Rev. 2021 Apr 19;4(4):CD011535. doi: 10.1002/14651858.CD011535.pub4. Cochrane Database Syst Rev. 2021. Update in: Cochrane Database Syst Rev. 2022 May 23;5:CD011535. doi: 10.1002/14651858.CD011535.pub5. PMID: 33871055 Free PMC article. Updated.
-
Antioxidants to prevent respiratory decline in people with Duchenne muscular dystrophy and progressive respiratory decline.Cochrane Database Syst Rev. 2021 Dec 1;12(12):CD013720. doi: 10.1002/14651858.CD013720.pub3. Cochrane Database Syst Rev. 2021. PMID: 34850383 Free PMC article.
References
Publication types
Grants and funding
LinkOut - more resources
Full Text Sources
Miscellaneous

