. 2025 Jul 24:09727531251356049.
doi: 10.1177/09727531251356049. Online ahead of print.

Enhanced Neuroprotection by Diosgenin and Pterostilbene Combination Against Neurotoxicity Induced by Amyloid-Β 1-42 in SH-SY5Y Differentiated Cell Models

Affiliations

Enhanced Neuroprotection by Diosgenin and Pterostilbene Combination Against Neurotoxicity Induced by Amyloid-Β 1-42 in SH-SY5Y Differentiated Cell Models

Syeda Jabeen Fatima et al. Ann Neurosci. .

Abstract

Background: Alzheimer's disease (AD) is the predominant age-related neurodegenerative condition, characterised by the gradual and irreversible loss of neurons. Key pathological features include amyloid plaques and neurofibrillary tangles, which trigger a chronic inflammatory response in the brain, leading to microglial activation and proliferation.

Purpose: This study evaluated the neuroprotective potential of diosgenin (DGN) and pterostilbene, two phytoconstituents with known antioxidant and anti-inflammatory properties, in amyloid-β 1-42 exposed SH-SY5Y cells.

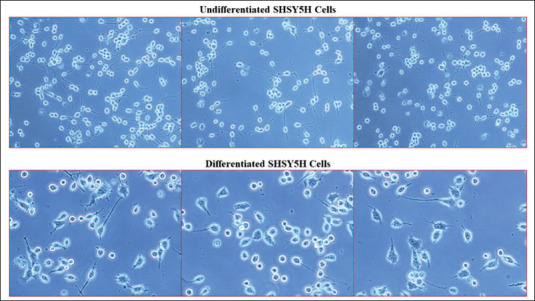
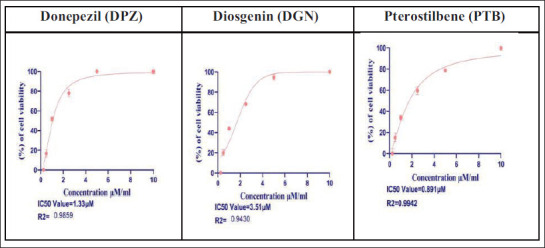
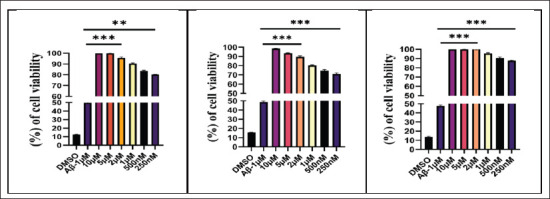
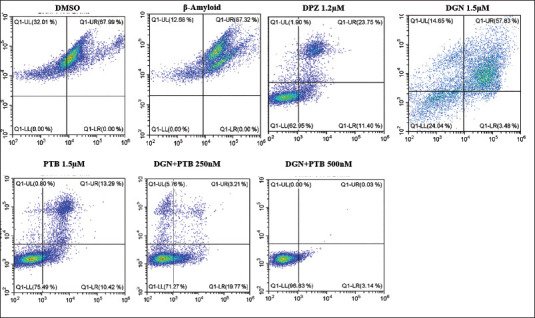
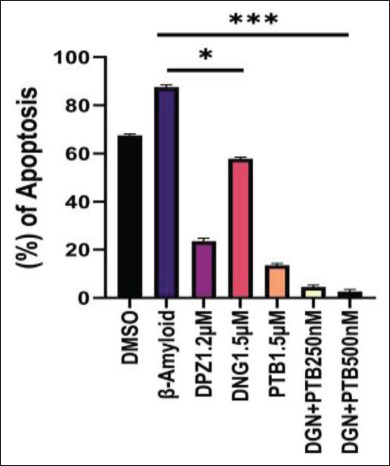
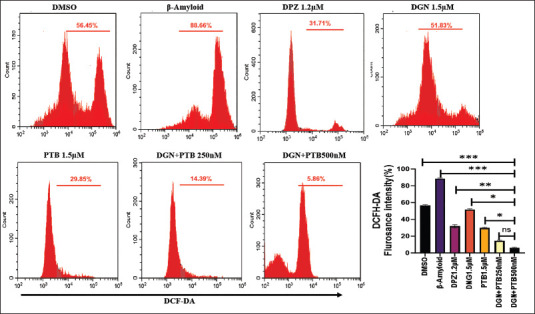
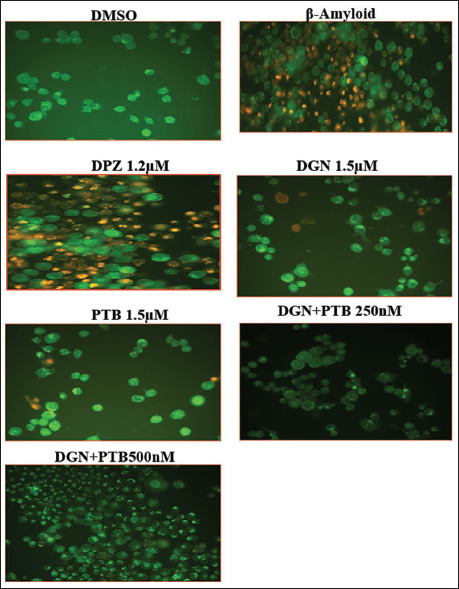
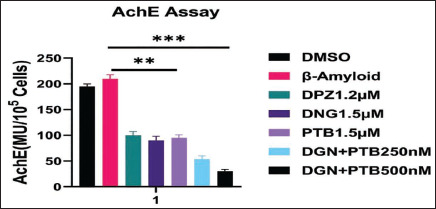
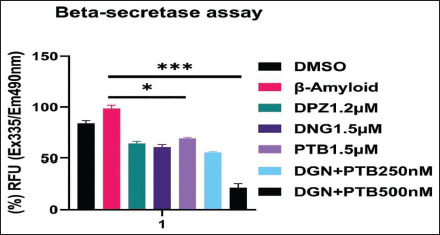
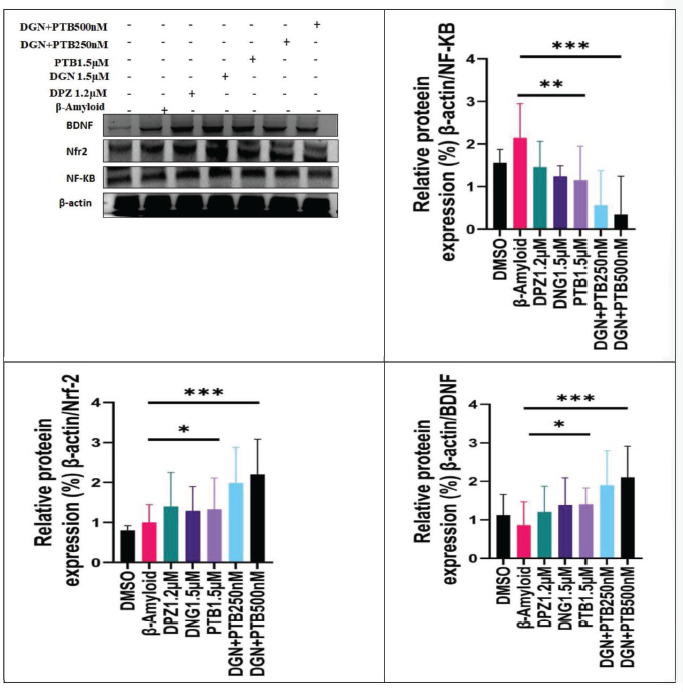
Methods: Human neuroblastoma cells were cultured and neurodifferentiated with retinoic acid, then exposed to amyloid-β 1-42 to simulate the AD model. Treatments included DGN (1.5 µM), pterostilbene (PTB) (1.5 µM), their combination (0.25 µM and 0.5 µM), and donepezil (1.2 µM) as a standard drug for comparison. The effects of treatments were assessed through cell viability, reactive oxygen species (ROS) levels, apoptosis, inflammatory cytokines, and BDNF levels using various assays, including flow cytometry, ELISA, Western blotting, and inhibitory assays for NOS, H2O2-mediated oxidative stress, DPPH, AChE, and β-secretase.

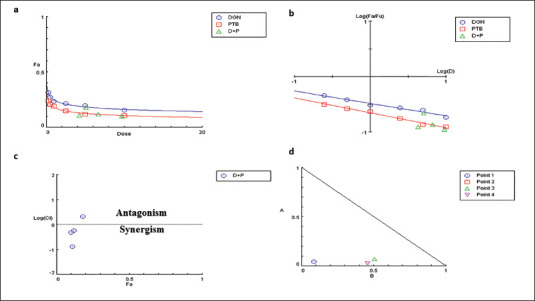
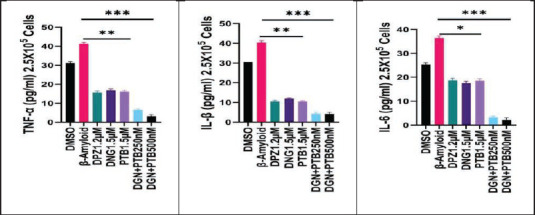
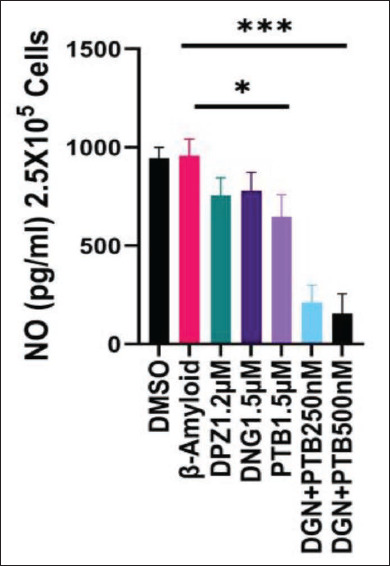
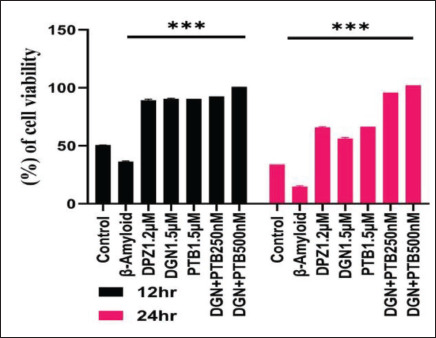
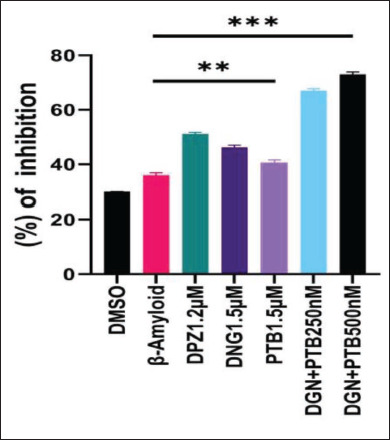
Results: DGN and PTB combination indicated increased cell viability, reduced microglial activation, decreased apoptosis, and lower ROS levels, with the maximum effect observed in the combination group (0.5 µM). Combination treatments also showed maximum inhibition in various assays and reduced levels of cytokines while upregulating BDNF, highlighting their neuroprotective, anti-inflammatory, and antioxidant activities.

Conclusion: The findings suggest that the combination of DGN and PTB may serve as an effective neuroinflammatory modulator in managing neurodegenerative diseases.

Keywords: Alzheimer’s disease; diosgenin; neuroinflammation; neuroprotection; pterostilbene.


Conflict of interest statement

The authors declared no potential conflicts of interest with respect to the research, authorship and/or publication of this article.

Figures

Figure 1.
Figure 1.. Represents Retinoic Acid (RA) Induced Neuronal Differentiation and Morphological Changes in SH-SY5Y Cells. SH-SY5Y undifferentiated cells have shorter neurites. While neuronal-differentiated SH-SY5Y cells show RA-induced neurites with outgrowth.
Figure 2.
Figure 2.. Graphical Representation of the IC50 Values of the Amyloid β Inhibitors DPZ, DGN and PTB in Aβ1-42-treated SHSY5Y Cells.
Figure 3.
Figure 3.. Represents Amyloid β Inhibitors DPZ, DGN and PTB, Reducing the Cytotoxicity Induced by Aβ1-42 in a Dose-dependent Manner, Compared to Control DMSO and Amyloid β-treated Group. Cytotoxicity was quantified using MTT dye reduction. Data were represented as a median ± SD standard deviation (n = 3; ns = not significant; **p < .01; ***p < .001 using one-way ANOVA Dunnett’s test.
Figure 4.
Figure 4.. The CompuSyn Reports of Diosgenin (DGN) and (PTB) and Their Combinations at 24 Hours (a). The Relationship Between Fa and Dose in SHSY5Y Cells Is Demonstrated by the Dose-effect Curve. Dose-effect Curve Demonstrating Fa and Dose Relationship in SHSY5Y Cells (b), Median-effect (ME) Plot Illustrates Remapping of the Dosage Effect Curve to Get the IC50 Value. The Value Was Derived from the ME plot’s X-intercept. ‘Potency’ in SHSY5Y Cells Is Indicated by the ME Dosage at the IC50 Value. (c) Seven Combination Data Points Are Shown by the Combination Index Plot, of Which Two Depict an Additive Relationship and the Other Five Show a Synergistic Relationship (CI < 1). (d) Substantial Antagonism Was Evident in the Simulation at Low Fa. An isobologram with 50%, 75%, and 90% Inhibitions Is Displayed in SHSY5Y Cells. Diosgenin and Pterostilbene’s Data Points on the Diagonal Line Show Additive Effects, Synergistic Effects Are Shown on the Lower Left, and Antagonistic Effects Are Shown on the Upper Right. IC50, IC75, and IC90 in This Indicate Synergism.
Figure 5.
Figure 5.. Representative Dot Plots for the Effect of Apoptosis on Aβ1-42 Treated SHSY5Y Cells Following Treatment with Diosgenin, Pterostilbene and Their Combinations. Flow cytometry and Annexin V-FITC/PI double staining were used to measure cell apoptosis.
Figure 6.
Figure 6.. Represents Statistical Analysis of Flow Cytometry Results Quantification for Apoptosis Study in SHSY5Y Cells for the Following Groups: DMSO, Donepezil (DPZ), Diosgenin (DGN), Pterostilbene (PTB) and DGN+PTB Combination Groups. Data were represented as a median ± SD standard deviation (n = 3; ns = not significant; **p < .01; ***p < .001 using one-way ANOVA Dunnett’s test.
Figure 7.
Figure 7.. Representative Images Showing ROS Expression in SH-SY5 Cells. The SHSY5H cells were dyed with H2DCFDA to detect ROS levels. SHSY5H cells from the control DMSO, Beta-amyloid, DPZ, DGN, PTB and DGN+PTB (0.25 and 0.5 µM)—supplemented IVM system. Comparative histograms showing a fold change relative to the background level of untreated cells [DC(−)], representing the mean fluorescence intensity of the DCF dye [DC(+)]. Data were represented as a median ± SD standard deviation (n = 3; ns = not significant; **p < .01; ***p < .001 using one-way ANOVA Dunnett’s test.
Figure 8.
Figure 8.. AO/EB Staining of SH-SY5Y Cell Culture Showing the Neuroprotective Effect of the Diosgenin and Pterostilbene Treatments by Decreasing the Amyloid-β Induced Glial Activation. (a) DMSO, (b) Amyloid-β, (c) Donepezil (DPZ), (d) Diosgenin (DGN), (e) Pterostilbene (PTB), (f) Diosgenin+Pterostilbene (DGN+PTB 250 nm), (g) Diosgenin+Pterostilbene (DGN+PTB 500 nm). Staining causes necrotic dead cells to appear orange and living cells to appear green.
Figure 9.
Figure 9.. Graphical Representation of the Effects of Diosgenin and Pterostilbene Treatments on Levels of Proinflammatory Mediators Determined by ELISA. Data were represented as a median ± SD standard deviation (n = 3; ns = not significant; **p < .01; ***p < .001 using one-way ANOVA Dunnett’s test.
Figure 10.
Figure 10.. Effect of Diosgenin and Pterostilbene Treatments on the Nitric Oxide Inhibitory Nature of the Treatment Groups. The inhibitory activity was highest in the diosgenin+pterostilbene combination group, reported by low levels of NO, which was very significant. Data were represented as a median ± SD standard deviation (n = 3; ns = not significant; **p < .01; ***p < .001 using one-way ANOVA Dunnett’s test.
Figure 11.
Figure 11.. Represents Percentage Cell Viability for DPZ, DGN and PTB Treatment in 10 µM Aβ1-42 Treated SHSY5Y Cells. The MTT dye reduction method was used to measure cytotoxicity. Data were represented as a median ± SD standard deviation (n = 3; ns = not significant; **p < .01; ***p < .001 using one-way ANOVA Dunnett’s test.
Figure 12.
Figure 12.. Percentage Inhibition of Oxidative Stress in 10 µM Aβ1-42 Treated SHSY5H Cells Given Diosgenin and Pterostilbene Treatment as per Experimental Groups. Data were represented as a median ± SD standard deviation (n = 3; ns = not significant; **p < .01; ***p < .001 using one-way ANOVA Dunnett’s test.
Figure 13.
Figure 13.. AChE Activity in SH-SY5Y Cells Treated as per Specified Treatment Groups Using Ellman’s Technique. Maximum significant inhibition in AChE activity was seen in the combination of diosgenin+pterostilbene 0.25 and 0.5 µM treatment groups in comparison to control (DMSO) and standard (Donepezil) treatment groups. Data were represented as a median ± SD standard deviation (n = 3; ns = not significant; **p < .01; ***p < .001 using one-way ANOVA Dunnett’s test.
Figure 14.
Figure 14.. β-secretase Enzymatic Activity in SH-SY5Y Cells Treated as per Specified Treatment Groups Revealed a Significant Decrease in Fluorescence Intensity of the Treatment Groups Compared to Control Groups, Indicative of Decreased β-secretase Enzymatic Activity of Samples, Indicating the Reduction of Amyloid β Plaque Formation. The decrease in fluorescence intensity was highly significant ( ***p > .01) in the DGN+PTB (0.5 µM) combination group when compared to the control group. Data were represented as a median ± SD standard deviation (n = 3; ns = not significant; **p < .01; ***p < .001 using one-way ANOVA Dunnett’s test.
Figure 15.
Figure 15.. Representative Western Blots and Relative Protein Expressions of NF-KB, Nfr2 and BDNF in 10 µM Aβ1-42 Treated SH-SY5Y Cells Given Diosgenin and Pterostilbene Treatment as per Experimental Groups. Data were represented as a median ± SD standard deviation (n = 3; ns = not significant; **p < .01; ***p < .001 using one-way ANOVA Dunnett’s test.

Similar articles

References

    1. Feigin VL, Vos T, Nichols E, et al. The global burden of neurological disorders: Translating evidence into policy. Lancet Neurol 2019. Mar 1; 19: 255–265. DOI: 10.1016/S1474-4422 (19)30411-9 - PMC - PubMed
    1. Scheff SW, Price DA, Schmitt FA, et al. Synaptic alterations in CA1 in mild Alzheimer disease and mild cognitive impairment. Neurology 2007. May 1; 68: 1505–1508. DOI: 10.1212/01.wnl.0000260698.46517 - PubMed
    1. Ross CA and Poirier MA.. Protein aggregation and neurodegenerative disease. Nat Med 2004; 10(Suppl): S10–S17. - PubMed
    1. Emerit J, Edeas M and Bricaire F.. Neurodegenerative diseases and oxidative stress. Biomed Pharmacother 2004; 58(1): 39–46. DOI: 10.1016/j.biopha.2003.11.004 - PubMed
    1. Streit WJ. Microglia and neuroprotection: implications for Alzheimer’s disease. Brain Res Bull 2005; 48(2): 234–239. DOI: 10.1016/j.brainresrev.2004.12.013 - PubMed

LinkOut - more resources