. 2025 Jul 25;29(1):469-487.
doi: 10.1080/19768354.2025.2536022. eCollection 2025.

Zanthoxylum schinifolium extracts enhance 3T3-L1 adipocyte differentiation via CHOP inhibition and PPARγ activation

Affiliations

Zanthoxylum schinifolium extracts enhance 3T3-L1 adipocyte differentiation via CHOP inhibition and PPARγ activation

Jiseok Lee et al. Anim Cells Syst (Seoul). .

Abstract

Zanthoxylum schinifolium (ZS), which is widely used as a seasoning and traditional medicine in East Asia, has demonstrated pharmacological potential. This study investigated the effects of the leaf and twig extracts of ZS (LZSE and TZSE, respectively), which are native to the Honam region of Korea, on adipocyte differentiation and assessed the ligand-binding energy score of their components to bind peroxisome proliferator-activated receptor gamma (PPARγ), a critical regulator of adipogenesis and metabolic health. LZSE and TZSE were prepared using 70% ethanol, and their molecular effects on adipocyte differentiation were evaluated in 3T3-L1 preadipocytes. Single compounds from the extracts were identified using UPLC-ESI-Q-TOF-MS, and their ligand-binding energy scores were calculated via in silico molecular docking studies. PPARγ activity was further confirmed through reporter assays. LZSE and TZSE significantly promoted adipocyte differentiation, as demonstrated by morphological changes and the increased mRNA and protein levels of key adipogenic and lipogenic genes, such as PPARγ and CCAAT-enhancer-binding protein alpha (C/EBPα). LZSE specifically enhanced adipogenesis without inducing cytotoxicity, attributed to the inhibition of C/EBP homologous protein (CHOP) and stimulation of mitotic expansion. Additionally, UPLC-ESI-Q-TOF-MS identified several active compounds in LZSE and TZSE, and in silico docking revealed the high binding affinity of these compounds for the full-agonist ligand-binding domain of PPARγ. LZSE and TZSE could emerge as novel antidiabetic drug candidates based on their effects on adipocyte differentiation and PPARγ activation. Furthermore, the active compounds identified in these extracts hold promise as tentative PPARγ agonists, highlighting their therapeutic potential in the treatment of metabolic disorders.

Keywords: Adipocytes; Zanthoxylum schinifolium; adipogenesis; differentiation; molecular docking.


Conflict of interest statement

No potential conflict of interest was reported by the author(s).

Figures
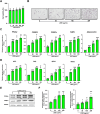
Figure 1.
Figure 1.
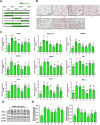
Effects of LZSE on 3T3-L1 adipocyte differentiation. Each indicated variable dose of LZSE or DMSO (0 µg/mL) was administered according to the respective experimental scheme. (A) The viability of 3T3-L1 preadipocytes treated with various concentrations of LZSE (0, 50, 100, 200, and 300 µg/mL) was measured using a WST-8 assay kit. (B) Oil Red O staining was performed on 3T3-L1 cells differentiated in induction medium containing 0.17× MDI (3-isobutyl-1-methylxanthine, dexamethasone and insulin) in the absence (0 µg/mL) or presence of LZSE (50, 100, and 200 µg/mL). Scale bar, 200 µm; magnification, × 100. (C, D) Quantitative real-time PCR was performed to measure the mRNA expression of adipogenic and lipogenic genes after 6 days of differentiation in the absence (0 µg/mL) or presence of LZSE. (E) Western blot analysis was performed to measure PPARγ and FABP4 protein expression levels. HSP90 was used as a loading control. (E, F) Quantification of PPARγ and FABP4 protein levels from panel. All data are presented as the mean ± SEM from two independent experiments (n = 4). *, p < 0.05; **, p < 0.01; ***, p < 0.001 versus the control group.
Figure 2.
Figure 2.
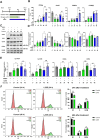
Stage-specific effects of LZSE on the differentiation of 3T3-L1 preadipocytes. (A) Schematic representation of the experimental schedule for adipocyte differentiation. Cells were treated with DMSO (group 1) or 100 µg/mL LZSE for various durations, as indicated in green (treatment period). (B) Lipid accumulation was evaluated by Oil Red O staining after 6 days of differentiation. Scale bar, 200 µm; magnification, × 100. (C) mRNA expression levels of adipogenic and lipogenic genes were measured by qRT-PCR after 6 days of differentiation. Data are presented as the mean ± SEM from two independent experiments (n = 4). (D) Protein expression levels of PPARγ and FABP4 were analyzed by Western blotting. Both HSP90 and GAPDH were used as loading controls. (E) Quantification of relative PPARγ and FABP4 protein levels using ImageJ software. Data are presented as the mean ± SEM from two independent experiments (n = 3). *, p < 0.05; **, p < 0.01; ***, p < 0.001 versus the control group (1) and #, p < 0.05; ##, p < 0.01; ###, p < 0.001 versus the LZSE-treated group for 6 days (2).
Figure 3.
Figure 3.
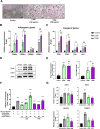
Regulatory mechanism of LZSE during the early stage of adipocyte differentiation. (A) Schematic representation of the experimental schedule for early-stage adipogenesis following treatment with DMSO (control) or 100 µg/mL LZSE for 0, 24, or 48 h. (B) Relative gene expression levels were measured by qRT-PCR under the indicated conditions during the early differentiation phase. Data are presented as the mean ± SEM from two independent experiments (n = 6). (C) Protein expression of key adipogenic markers was analyzed by western blotting. (D) Relative protein levels of PPARγ and FABP4 were quantified using ImageJ software. Data are presented as the mean ± SEM from two independent experiments (n = 3). (E) Expression of cell cycle-related genes was assessed by qRT-PCR. Data are presented as the mean ± SEM from two independent experiments (n = 6). (F) Cell cycle distribution was assessed by flow cytometry after propidium iodide (PI) staining. The percentage of cells in G1, S and G2/M phases was calculated using the J.V. Watson algorithm. Data are presented as the mean ± SEM from two independent experiments (n = 4). *, p < 0.05; **, p < 0.01; ***, p < 0.001 versus the control group and #, p < 0.05; ##, p < 0.01; ###, p < 0.001 versus the DMSO-treated control group (24 or 48 h).
Figure 4.
Figure 4.
LZSE and TZSE promote PPARγ activity and target gene expression, enhancing adipocyte differentiation. (A) 3T3-L1 cells were differentiated in the presence of DMSO (control), 100 µg/mL LZSE, or TZSE for 6 days. Cells were then fixed with 4% formaldehyde and stained with Oil Red O to visualize lipid accumulation. Scale bar, 200 µm; magnification, × 100. (B and C) mRNA expression levels of adipogenic (B) and lipogenic (C) genes were assessed by qRT-PCR following differentiation in the presence of 100 µg/mL LZSE or TZSE. (D) Protein expression levels of PPARγ and FABP4 were analyzed by Western blotting; HSP90 was used as the loading control. (E) Quantification of PPARγ and FABP4 protein levels was performed using ImageJ software. (F) HEK cells were transfected with the indicated plasmid DNA. After 24 h, cells were treated with DMSO (control), 10 µM rosiglitazone, or varying concentrations of LZSE or TZSE for additional 24 h. Luciferase activity was measured and normalized to β-galactosidase activity. Data are presented as the mean ± SEM from two independent experiments (n = 8). (G) Fully differentiated 3T3-L1 adipocytes induced by 10 µM rosiglitazone were further treated with DMSO (control), rosiglitazone or 100 µg/mL LZSE or TZSE for 48 h. Expression levels of PPARγ target genes were assessed by qRT-PCR and normalized to 36B4. Data are presented as the mean ± SEM from two independent experiments (n = 4). *, p < 0.05; **, p < 0.01; ***, p < 0.001 versus the control group (DMSO) and #, p < 0.05; ##, p < 0.01; ###, p < 0.001 versus the LZSE-treated group.
Figure 5.
Figure 5.
Base peak intensity BPI chromatogram of the 70% ethanol extracts of ZS. BPI chromatogram of LZSE (A) and TZSE (B).
Figure 6.
Figure 6.
Molecular docking of compounds with PPARγ. Binding energy scores (ΔG, kcal/mol) are shown along with visualizations of the interactions between each compound and the PPARγ ligand-binding domain. The following compounds are represented by their respective colors: navy, rosiglitazone; brown, 4-caffeoylquinic acid; blue, neochlorogenic acid; yellow, chlorogenic acid; magenta, 3-feruloylquinic acid; mint, lariciresinol glucoside; cyan, 4,5-dicaffeoylquinic acid; light green, hesperidin; pink, 1,5-dicaffeoylquinic acid; black, 4-coumaroylquinic acid; purple, 1,3-dicaffeoylquinic acid; deep green, hesperetin; light pink, dihydroferulic acid glucuronide; grey, caffeoylquinic acid; deep sky, leeaoside; deep purple, benzyl β-primeveroside; orange, protocatechuic acid glucoside.

Similar articles

References

    1. Abubakar AR, Haque M.. 2020. Preparation of medicinal plants: basic extraction and fractionation procedures for experimental purposes. Journal of Pharmacy and Bioallied Sciences. 12(1):1–10. doi: 10.4103/jpbs.JPBS_175_19. - DOI - PMC - PubMed
    1. Ahmadian M, Suh JM, Hah N, Liddle C, Atkins AR, Downes M, Evans RM.. 2013. PPARγ signaling and metabolism: the good, the bad and the future. Nat Med. 19(5):557–566. doi: 10.1038/nm.3159. - DOI - PMC - PubMed
    1. Bortolini M, Wright MB, Bopst M, Balas B.. 2013. Examining the safety of PPAR agonists – current trends and future prospects. Expert Opin Drug Saf. 12(1):65–79. doi: 10.1517/14740338.2013.741585. - DOI - PubMed
    1. Brust R, Shang J, Fuhrmann J, Mosure SA, Bass J, Cano A, Heidari Z, Chrisman IM, Nemetchek MD, Blayo A-L.. 2018. A structural mechanism for directing corepressor-selective inverse agonism of PPARγ. Nat Commun. 9(1):4687. doi: 10.1038/s41467-018-07133-w. - DOI - PMC - PubMed
    1. Cawley J, Biener A, Meyerhoefer C, Ding Y, Zvenyach T, Smolarz BG, Ramasamy A.. 2021. Direct medical costs of obesity in the United States and the most populous states. J Manag Care Spec Pharm. 27(3):354–366. doi: 10.18553/jmcp.2021.20410. - DOI - PMC - PubMed

LinkOut - more resources