. 2025 Jul 14:16:1604888.
doi: 10.3389/fimmu.2025.1604888. eCollection 2025.

Interferon Regulatory Factor 4 dose-dependently controls peripheral Treg cell differentiation and homeostasis by modulating chromatin accessibility in mice

Affiliations

Interferon Regulatory Factor 4 dose-dependently controls peripheral Treg cell differentiation and homeostasis by modulating chromatin accessibility in mice

Leonie Caroline Voß et al. Front Immunol. .

Abstract

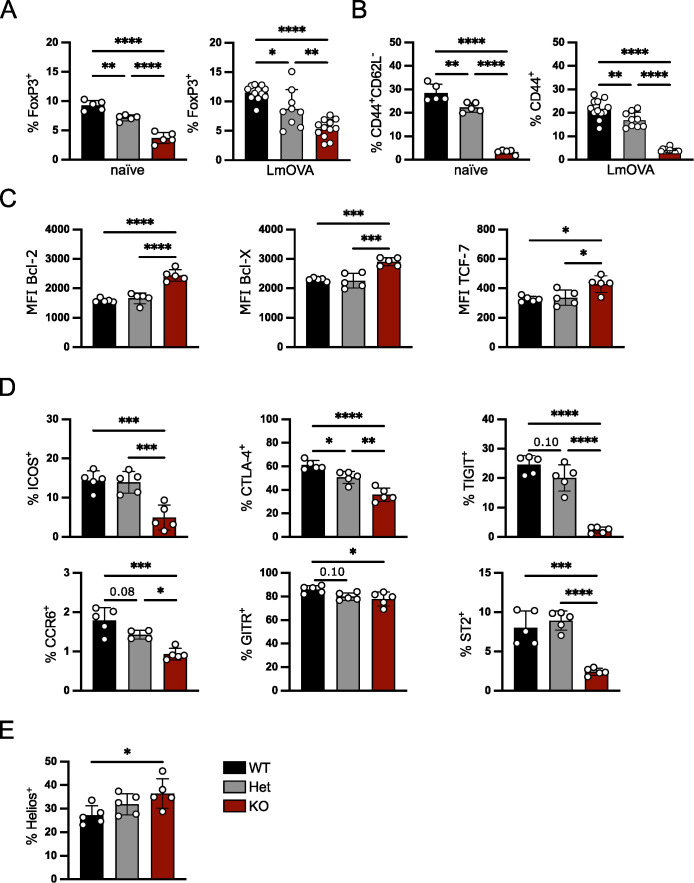
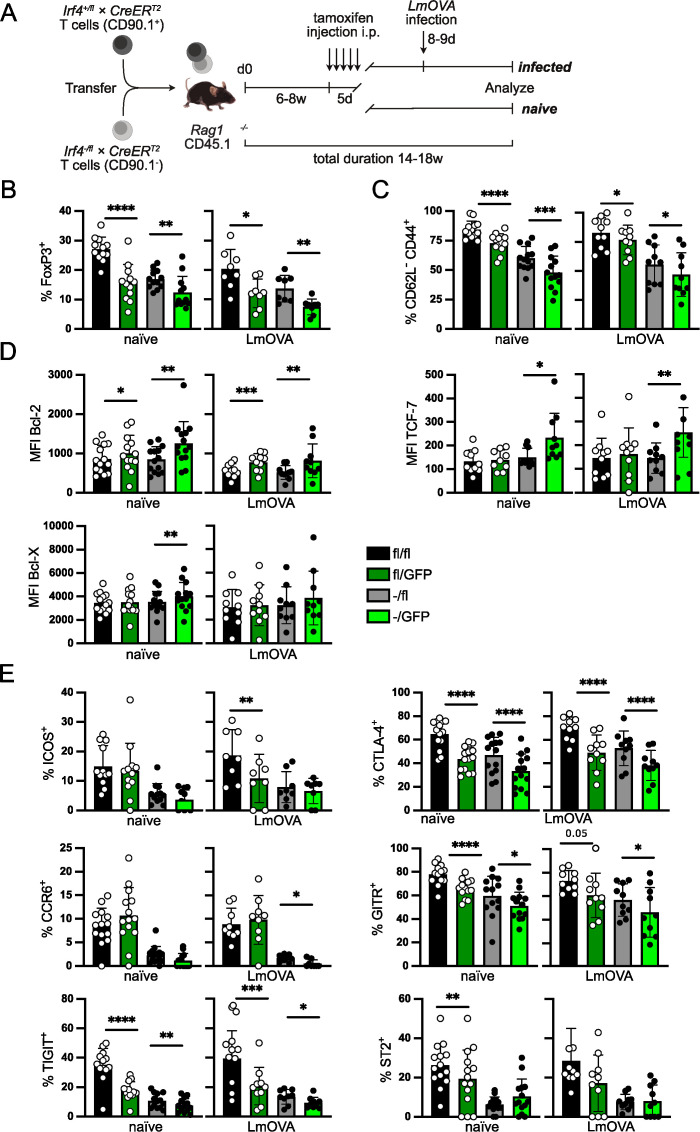
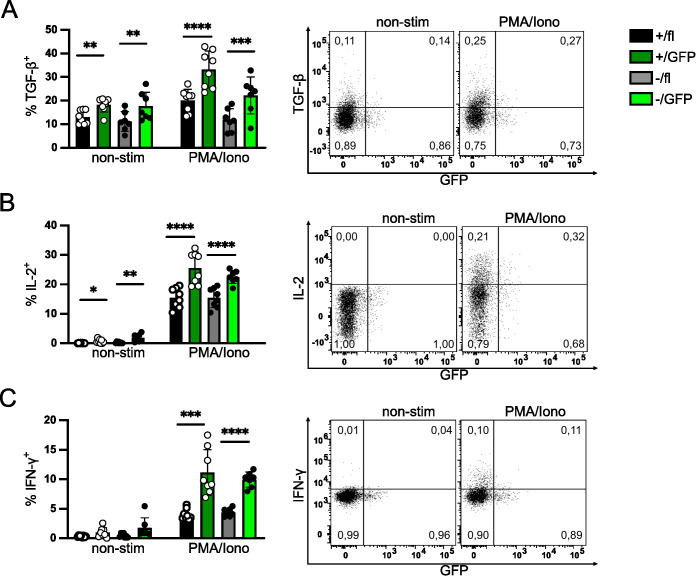
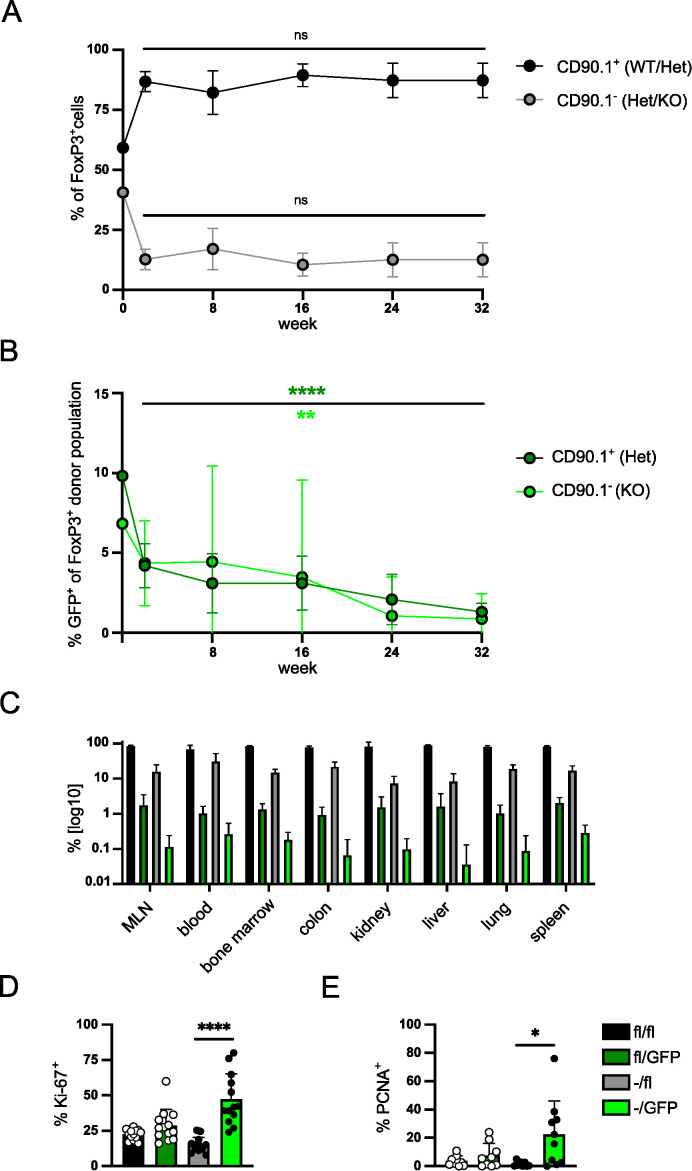
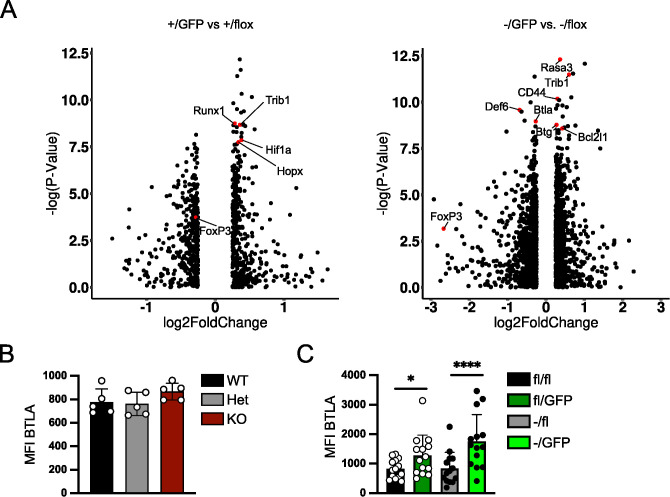
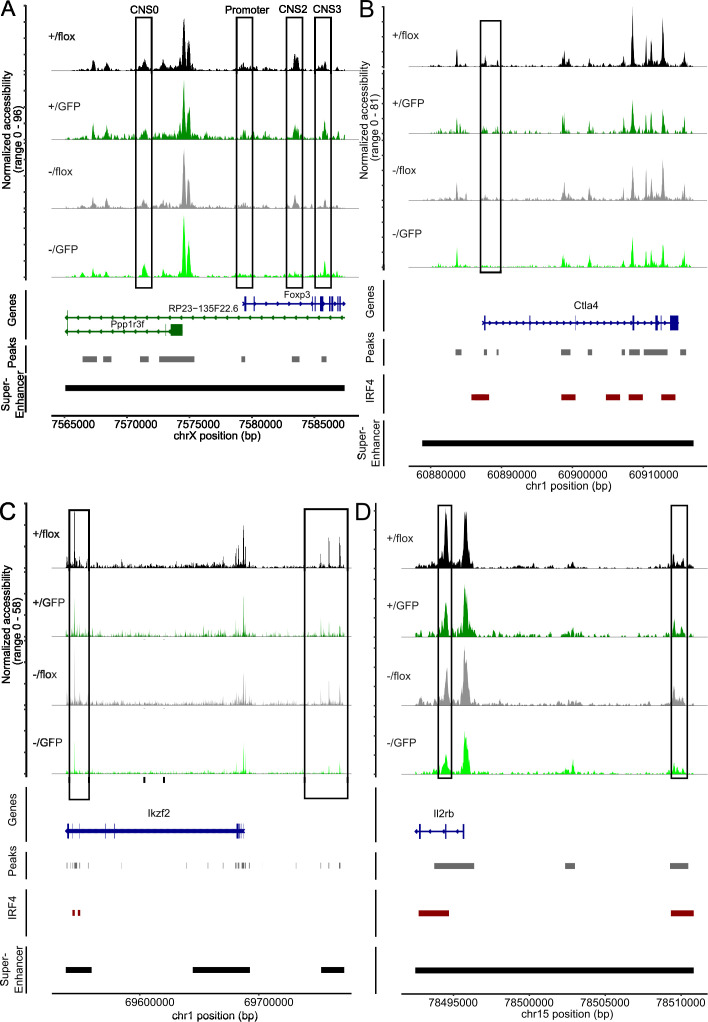
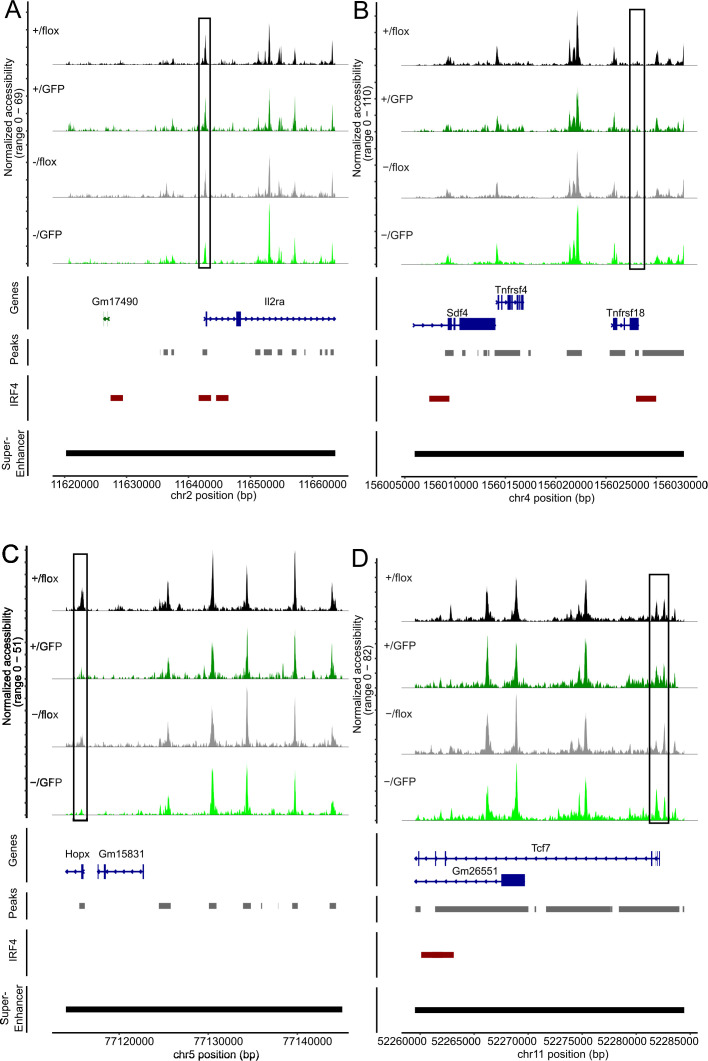
FoxP3+ regulatory T (Treg) cells restrict excessive immune responses and immunopathology as well as reactivity to self or environmental antigens and thus are crucial for peripheral immune tolerance. The transcription factor Interferon Regulatory Factor 4 (IRF4) controls differentiation and function of T cells. In Treg cells, IRF4 is required for peripheral activation and maturation to effector Treg (eTreg) cells with enhanced suppressive function. However, the mechanisms of Treg cell regulation by IRF4 are not fully understood. Here, we analyze the role of IRF4 in differentiation and maintenance of Treg cells using IRF4-deficient mice and a T cell transfer model, that allows Irf4 inactivation in peripheral T cells. We demonstrate that loss of one Irf4 allele already results in impaired eTreg cell differentiation and decreased Treg cell homeostasis, indicating that IRF4 controls peripheral Treg cell differentiation in a gene dosage dependent mode. Peripheral Irf4 inactivation was also associated with enhanced production of inflammatory but also inhibitory cytokines by Treg cells. ATAC sequencing of Treg cells after mutation of one or both Irf4 alleles revealed regions with altered accessibility in genes involved in Treg cell function. In the FoxP3 gene, Irf4 inactivation resulted in reduced ATAC signals in the promoter region and in the conserved non-coding sequence (CNS) 2, required for stability of FoxP3 expression in peripheral Treg cells in response to TCR stimulation. IRF4-deficient Treg cells also displayed a reduction in open chromatin in several Treg cell specific super enhancers, mainly located in proximity to potential IRF4 binding sites. In conclusion, our results demonstrate that IRF4 controls peripheral Treg cell differentiation and homeostasis in a gene dosage dependent manner.

Keywords: FoxP3; Interferon Regulatory Factor 4; T cells; assay for transposase-accessible chromatin (ATAC) sequencing; regulatory T cells.


Conflict of interest statement

The authors declare that the research was conducted in the absence of any commercial or financial relationships that could be construed as a potential conflict of interest.

Figures

Figure 1
Figure 1
IRF4 controls Treg cells in a gene dosage-dependent manner. FoxP3+ Treg cells from spleens of naïve Irf4 +/+, Irf4 +/- and Irf4 -/- mice or mice i.v. infected 10 days before with LmOVA were analyzed. (A) Percentages of FoxP3+ cells of CD4+ T cells. (B) percentages of CD44+CD62L- or CD44+ cells of FoxP3+ T cells from naïve and infected mice. (C) Mean fluorescence intensity (MFI) of staining for anti-apoptotic proteins Bcl-2, Bcl-X, and the transcription factor TCF-7 of FoxP3+ T cells. (D) Percentages of ICOS+, CTLA-4+, TIGIT+, CCR6+, GITR+ and ST2+ cells of FoxP3+ Treg cells. (E) Percentages of Helios+ cells of FoxP3+ Treg cells. (A–E) Representative results of three independent experiments with 2–5 mice per group in naïve mice and three independent experiments with 3–12 mice per group in infected mice. Mean ± SEM, one-way ANOVA with Tukey’s multiple comparisons test. (*p < 0.05, **p < 0.01, ***p < 0.001, ****p < 0.0001).
Figure 2
Figure 2
IRF4 expression level regulates effector Treg cell maintenance. (A) Scheme of T cell transfer experiments. T cells from Irf4 +/fl×CreER T2 or Irf4 fl/fl×CreER T2 mice (CD90.1+) and from Irf4 -/fl×CreER T2 mice (CD90.1-) were mixed in a ratio of 1:1. T cells were i.v. transferred into naïve CD45.1+ Rag1 -/- mice. Six to 8 weeks after transfer, recipient mice were treated i.p. with tamoxifen for 5 consecutive days. Mice were analyzed after tamoxifen treatment as indicated in the individual experiments. In some of the experiments, tamoxifen-treated recipient mice were in addition i.v. infected with LmOVA prior to analysis. (Of note: due to the low efficacy of recombination, GFP+ cells derived from Irf4 fl/fl×CreER T2 donors largely acquire an Irf4 fl/GFP genotype.) (B–E) Spleen cells from reconstituted and tamoxifen treated Rag1 −/− mice were analyzed 14–18 weeks after transfer. In the LmOVA groups, mice were additionally infected i.v. with LmOVA 8–9 days before analysis. (B) Percentages of FoxP3+ cells of CD4+ T cells. (C) Percentages of CD44+ CD62L- cells of Treg cells. (D) Mean fluorescence intensity (MFI) of staining for Bcl-2, Bcl-X, and TCF-7. (E) Percentages of ICOS+, CTLA-4+, TIGIT+, CCR6+, GITR+ and ST2+ cells of Treg cells. (B–E) Pooled results of three independent experiments for naïve mice and two independent experiments for LmOVA-infected mice. Mean ± SEM. Results of corresponding GFP+ and GFP- donor cell populations in individual mice were analyzed with paired t-test. (*p < 0.05, **p < 0.01, ***p < 0.001, ****p < 0.0001). Statistics for comparison of all groups are provided in Supplementary Table 1 .
Figure 3
Figure 3
IRF4 expression is not essential for cytokine expression in peripheral Treg cells. Cytokine expression of Treg cells with induced deletion of Irf4 alleles. Irf4 +/fl×CreER T2 and Irf4 -/fl×CreER T2 mice were treated with tamoxifen on 5 consecutive days and analyzed 6–7 weeks later. Spleen cells were cultured without stimulation or with PMA and ionomycin for 4h and cytokine expression in Treg cells was analyzed by intracellular antibody staining. Representative staining (gated on CD4+ CD90.1+ FoxP3+ Irf4 +/fl×CreER T2 T cells) and results for TGF-β/LAP+ (A), IL-2+ (B) and IFN-γ+ (C) of CD4+ FoxP3+ Treg cells. Figures in FACS plots give the fraction of cytokine+ cells of GFP- or GFP+ FoxP3+ cells, respectively. Graphs represent one of three independent experiments with 6–10 mice per group. Mean ± SEM. Results of corresponding GFP+ and GFP- donor cell populations in individual mice were analyzed with paired t-test. (*p < 0.05, **p < 0.01, ***p < 0.001, ****p < 0.0001). Statistics for comparison of all groups are provided in Supplementary Table 1 .
Figure 4
Figure 4
Induced deletion of Irf4 in Treg cells results in reduced suppressive function. CD4+ T cells were isolated from spleens of FIR×Irf4 -/fl×CreER T2 mice. FIR+ FoxP3+ cells were FACS-sorted and then cultured in the presence of anti-CD3 and anti-CD28 antibody-coated beads and IL-2. After 3 days, 4-Hydroxytamoxifen was added to the cultures. After 9 days, GFP- and GFP+ Treg cells were sorted and co-cultured in different ratios with Treg cell-depleted and eFluor 670-labelled responder CD4+ T cells from CD90.1+ mice in the presence of anti-CD3 antibodies. After 3 days, proliferation of CD90.1+ CD4+ T cells was determined by loss of eFluor 670 staining. (A). eFluor 670 staining of responder T cells cultured with GFP+ (green) and GFP- Treg cells (grey) at different Treg-to-responder cell ratios. Control: responder cells cultured without Treg cells. (B) Mean fluorescence intensity (MFI) of eFluor 670 staining of responder cells cultured under different conditions. (A, B) Results are representative of two independent experiments.
Figure 5
Figure 5
IRF4 is required for long-term survival of Treg cells. (A, B) FIR×Irf4+/ fl×CreER T2 (CD90.1+) and FIR×Irf4-/ fl×CreER T2 (CD90.1-) mice were treated with tamoxifen for 5 consecutive days. 3–4 weeks after tamoxifen treatment, T cells from spleens were mixed at a ratio of roughly 1:1 (0 weeks) and 8×10⁵ cells were transferred into naïve Rag1 −/− mice. T cells from peripheral blood were analyzed at the indicated time points for percentages of CD90.1- and CD90.1+ Treg cells (A) and for percentages of GFP+ cells within CD90.1- and CD90.1+ Treg cells (B). (C) After 32 weeks, T cells were isolated from blood, lymphoid tissues and peripheral tissues. Percentages of Treg cells in different CD4+ donor T cell populations were determined. (D, E) Spleen cells from Rag1 -/- mice reconstituted, treated, and analyzed as described in Figure 2 were analyzed for percentages of Ki-67+ cells (D) and of PCNA+ cells (E) of Treg cells. Graphs represent one of two independent experiments with at least 10 mice per group (A–C) or are pooled from three (D) or two (E) independent experiments. Mean ± SEM. Results of corresponding GFP+ and GFP- donor cell populations in individual mice were analyzed with paired t-test. (*p < 0.05, **p < 0.01, ****p < 0.0001). Statistics for comparison of all groups are provided in Supplementary Table 1 .
Figure 6
Figure 6
Peripheral deletion of Irf4 alleles causes altered chromatin accessibility in Treg cells. (A–C) Rag1 −/− mice were reconstituted with 4×10⁵ T cells from each naïve Irf4 +/fl×CreER T2 (CD90.1+) and Irf4 -/fl×CreER T2 (CD90.1-) mice. After 5 weeks, recipients were treated with tamoxifen on 5 consecutive days and after further 5 weeks, recipients were infected with LmOVA. Eight days after infection, CD90.1+ GFP- Irf4 +/fl, CD90.1+ GFP+ Irf4 +/fl, CD90.1- GFP- Irf4 -/fl, and CD90.1- GFP+ Irf4 -/fl CD4+ T cells were sorted and similar numbers of each population were analyzed by single cell ATACseq. (A) Cells with an open Foxp3 locus were analyzed for differential accessibility between GFP+ Irf4 +/fl and GFP- Irf4 +/fl Treg cells (left) and GFP+ Irf4 -/fl and GFP- Irf4 -/fl Treg cells (right). (B) Mean fluorescence intensity (MFI) of staining for BTLA of FoxP3+ Treg cells from spleens of naïve Irf4 +/+, Irf4 +/- and Irf4 -/- mice. Representative results of three independent experiments. Mean ± SEM, one-way ANOVA with Tukey’s multiple comparisons test. (C) Rag1 −/− mice were reconstituted with 4×10⁵ T cells from each naïve Irf4 fl/fl×CreER T2 (CD90.1+) and Irf4 -/fl×CreER T2 mice. After 6–8 weeks, recipients were treated with tamoxifen on 5 consecutive days. Spleen cells were analyzed 14–18 weeks after transfer. Mean fluorescence intensity (MFI) of staining for BTLA. Pooled results of three independent experiments. Mean ± SEM. Results of corresponding GFP+ and GFP- donor cell populations in individual mice were analyzed with paired t-test. (*p < 0.05, ****p < 0.0001). Statistics for comparison of all groups are provided in Supplementary Table 1 .
Figure 7
Figure 7
Peripheral deletion of Irf4 alleles results in reduced chromatin accessibility in the gene loci of Foxp3, Ctla4, Ikzf2 and Il2rb. (A) ATAC profiles for the of Foxp3 gene locus of GFP- Irf4 +/fl, GFP+ Irf4 +/fl, GFP- Irf4 -/fl, and GFP+ Irf4 -/fl Treg cells. The positions of the Foxp3 promotor and the regulatory sites CNS0, CNS2, and CNS3, as well as the position of the Treg-cell specific super enhancer on the X chromosome are indicated. (B–D) ATAC profiles for the Ctla4 (B), Ikzf2 (C) and Il2rb (D) gene loci in GFP⁻ Irf4 +/fl, GFP⁺ Irf4 +/fl, GFP⁻ Irf4 -/fl, and GFP⁺ Irf4 -/fl Treg cells. Positions with altered ATAC signals, potential IRF4 binding sites and super enhancer are indicated.
Figure 8
Figure 8
Peripheral deletion of Irf4 alleles results in reduced chromatin accessibility in the gene loci of Il2ra, Tnfrsf18, Hopx and Tcf7. ATAC profiles for the gene loci of IL2Ra (A), Tnfrsf18 (B), Hopx (C) and Tcf7 (D) of GFP- Irf4 +/fl, GFP+ Irf4 +/fl, GFP- Irf4 -/fl, and GFP+ Irf4 -/fl Treg cells. Positions with altered ATAC signals, potential IRF4 binding sites and super enhancer are indicated.

Similar articles

References

    1. Huber M, Lohoff M. IRF4 at the crossroads of effector T-cell fate decision. Eur J Immunol. (2014) 44:1886–95. doi: 10.1002/eji.201344279, PMID: - DOI - PubMed
    1. Lohoff M, Mittrücker HW, Prechtl S, Bischof S, Sommer F, Kock S, et al. Dysregulated T helper cell differentiation in the absence of interferon regulatory factor 4. Proc Natl Acad Sci USA. (2002) 99:11808–12. doi: 10.1073/pnas.182425099, PMID: - DOI - PMC - PubMed
    1. Brüstle A, Heink S, Huber M, Rosenplänter C, Stadelmann C, Yu P, et al. The development of inflammatory T(H)-17 cells requires interferon-regulatory factor 4. Nat Immunol. (2007) 8:958–66. doi: 10.1038/ni1500, PMID: - DOI - PubMed
    1. Cretney E, Xin A, Shi W, Minnich M, Masson F, Miasari M, et al. The transcription factors Blimp-1 and IRF4 jointly control the differentiation and function of effector regulatory T cells. Nat Immunol. (2011) 12:304–11. doi: 10.1038/ni.2006, PMID: - DOI - PubMed
    1. Raczkowski F, Ritter J, Heesch K, Schumacher V, Guralnik A, Höcker L, et al. The transcription factor Interferon Regulatory Factor 4 is required for the generation of protective effector CD8+ T cells. Proc Natl Acad Sci USA. (2013) 110:15019–24. doi: 10.1073/pnas.1309378110, PMID: - DOI - PMC - PubMed

MeSH terms

LinkOut - more resources