. 2025 Jul 14:12:1621240.
doi: 10.3389/fmolb.2025.1621240. eCollection 2025.

Neuroprotective effect of silymarin-loaded nanoliposomes against monosodium glutamate-induced cerebellar motor deficit and Purkinje cell damage in experimental rats via PI3K/AKT pathway activation

Affiliations

Neuroprotective effect of silymarin-loaded nanoliposomes against monosodium glutamate-induced cerebellar motor deficit and Purkinje cell damage in experimental rats via PI3K/AKT pathway activation

Medhat Taha et al. Front Mol Biosci. .

Abstract

Background and aim: This study investigated the ameliorative effect of Silymarin-nanoliposome (SLNPs) against monosodium glutamate (MSG)-induced cerebellar toxicity, illuminating its impact on motor coordination.

Methods: Forty male Wistar albino rats were divided into four groups. Group I (control group): rats received 2 mL of 0.9% NaCl solution; Group II (SLNPs group): rats received SLNPs with a dose of 500 μg/kg bw orally; Group III (MSG group): rats received 3.5 mg/kg bw of MSG intraperitoneally; and Group IV: rats received combined treatment of MSG + SLNPs for ten consecutive days.

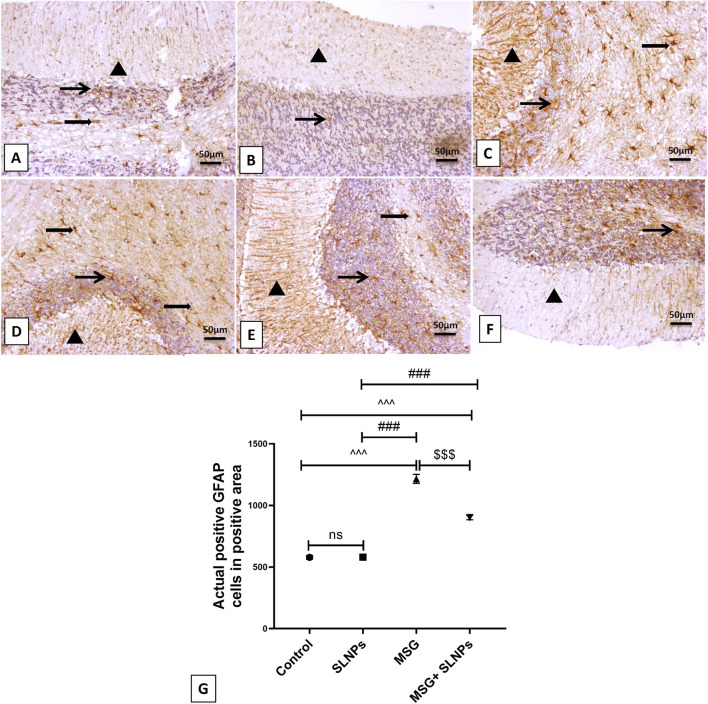
Results: MSG-induced cerebellar motor incoordination is represented by increased falls in rats and decreased tow latency spent on the rotarod test. Moreover, MSG altered cerebellar histological structure and significantly (p < 0.05) decreased antioxidant system activity and protein levels of phosphorylated phosphoinositide 3-kinases (p-PI3K), phosphorylated protein kinase B (p-AKT), and brain-derived neurotrophic factor (BDNF). Additionally, there is a decrease in the immunoexpression of nuclear factor erythroid 2-related factor 2 (Nrf2) and gene expression of heme oxygenase-1 (HO-1), tropomyosin receptor kinase B (TrkB), and anti-apoptotic B-cell lymphoma-2 (Bcl-2), alongside an increase in the sera and protein levels of proinflammatory cytokines tumor necrosis factor-alpha (TNF-α), interleukin-6 (IL-6), interleukin-1 beta (IL-1β), immunoexpression of glial fibrillary acidic protein (GFAP), nuclear factor kabba beta (NF-κB), caspase-3, and gene expression of proapoptotic Bax. However, SLNPs prevented MSG-induced cerebellar toxicity, improving motor coordination and morphological structure by enhancing antioxidant, anti-inflammatory, and anti-apoptotic activity by stimulating the PI3K/AKT pathway.

Conclusion: The current study indicated that SLNP administration protects against MSG-induced cerebellar damage, preventing cerebellar oxidative stress, inflammation, and apoptosis, opening the door to examining its clinical use in preventing MSG-induced cerebellar motor incoordination.

Keywords: apoptosis; cerebellar toxicity; monosodium glutamate; neuroinflammation; oxidative stress; silymarin nanoliposomes.


Conflict of interest statement

The authors declare that the research was conducted in the absence of any commercial or financial relationships that could be construed as a potential conflict of interest.

Figures

FIGURE 1
FIGURE 1
(A) the TEM characterization of SLNPs using a JEOL-JEM 2100 microscope, (B) the size distribution of the SLNPs, and (C) the zeta potential distribution of silymarin-loaded nanoliposomes.
FIGURE 2
FIGURE 2
Photomicrographs of cerebellar sections. (A,B) The control and SLNPs groups exhibit normal histology of the cerebellar layers, including the molecular (M), Purkinje (P), and granular (G) cell layers. (C) In the MSG group, Purkinje cells appear shrunken and angulated with cytoplasmic eosinophilia and karyopyknosis (thin arrow), surrounded by a mild number of glial cells. (D) The MSG group shows mild spongiosis in the molecular layer, a shrunken necrotic Purkinje cell layer (thin arrow) surrounded by proliferated glial cells, and a thickened granular layer with congested blood vessels (arrowhead). (E) In the MSG group, a focal area of hemorrhage is observed as an arrowhead in the vacuolated white matter layer (thick arrow). (F–H) The MSG + SLNPs group shows normal architecture in up to 90% of cerebellar layers, except for the white matter layer, which exhibits mild to moderate spongiosis (thick arrow) and occasional shrunken Purkinje cells (thin arrow). Image magnification: 100×; inset = 400×.
FIGURE 3
FIGURE 3
The effect of SLNPs and MSG on the cerebellar levels of oxidative stress markers. (A) TAC, (B) SOD, (C) GSH, and (D) CAT. The data are expressed as mean ± standard deviation (M ± SD), and statistical significance was determined using one-way ANOVA followed by Tukey’s post hoc test. Statistical significance is denoted as ^^^p, ^^p < 0.05 versus the control group, ###p, #p < 0.05 denotes significance compared to the SLNPs group, and $$$p < 0.05 versus the MSG group.
FIGURE 4
FIGURE 4
Representative IHC expression of Nrf2. (A,B) The control and SLNP groups (n = 10) exhibiting high expression of Nrf2 in the granular layer and Purkinje cell layer, with moderate expression in molecular neuronal cells. (C,D) The MSG group (n = 10) displaying faint expressions in the granular cell layer and Purkinje cell. (E,F) MSG + SLNPs (n = 10) demonstrating marked, intense immunopositive staining in molecular, Purkinje, and granular cell layers. Image magnification is 100x. The arrowhead indicates positive immunostained cells in the molecular layer; the thin arrow denotes positive Purkinje cells, and the thick arrow represents positive granular cells. (G) Histogram of actual positive Nrf2 cells in positive area. (H) Gene expression of HO-1 in cerebellar samples from different groups. All data are expressed as M ± SD. The data were analyzed for statistical significance using one-way ANOVA, followed by Tukey’s post hoc test for pairwise comparisons. Statistical significance is indicated as ^^^p < 0.05 vs. the control group; ###p < 0.05 vs. the SLNPs group, and $$$p < 0.05 vs. the MSG group.
FIGURE 5
FIGURE 5
The IHC expression of GFAP. (A,B) represent the control and SLNP groups (n = 10), displaying a mild expression of GFAP in the molecular, granular, and white matter cell layers. (C,D) depict the MSG group (n = 10) with marked, intense astrocytic immunoreactivity across the molecular, granular, and white matter cells. (E,F) show the MSG + SLNPs group (n = 10) with moderate immunopositive astrocytic staining in the granular cell layer and white matter layer, along with more fiber staining in the molecular cell layer. Arrowheads denote positive immunostained areas in the molecular layer; thin arrows indicate positive immunostained cells in the granular cell layer; and thick arrows point to positive astrocytes in the white matter cell layer. (G) Histogram of actual positive GFAP cells in positive area. All data are expressed as M ± SD. Differences were evaluated for statistical significance through one-way ANOVA, with Tukey’s test applied for post hoc analysis. Image magnification is set at 100x. ^^^p < 0.05 indicates statistical significance versus the control group, ###p < 0.05 signifies significance versus the SLNPs group, while $$$p < 0.05 signifies significance versus the MSG group.
FIGURE 6
FIGURE 6
The IHC expression of NF-κB across different treatment groups. In the control group (n = 10) (A), minimal NF-κB expression is observed in white matter cells without ex-pression in the granular and Purkinje cell layer or molecular neuronal cells. In the SLNPs group (n = 10) (B), mildly immunopositive stained cells are noticed in the Purkinje (more cytoplasmic) and granular and white matter cells. The MSG group (n = 10) (C,D) exhibits marked, intense expression in the granular cell layer, Purkinje cells with moderate to high expression in the molecular cell layer, and white matter cells. In the MSG + SLNPs group (n = 10) (E,F), moderately faintly immunopositive staining is observed in Purkinje (more cytoplasmic) and granular cell layers, with less expression in molecular and white matter layers. Magnification for images is 100x. Notations include arrowheads for positive immunostained cells in the molecular layer, thin arrows for positive Purkinje cells, thick arrows for positive granular cells, and twisted arrows indicating immunopositive stained white matter cells. (G) Histogram of actual positive NF-κB cells in positive area. Data are expressed as M ± SD. One-way ANOVA was performed to determine significance, supplemented by Tukey’s post hoc test for detailed group comparisons. Statistical significance is represented as ^^^p, ^p < 0.05 compared to the control group, ###p < 0.05 versus the SLNPs group, and $$$p < 0.05 versus the MSG group.
FIGURE 7
FIGURE 7
Serum (A–C) and cerebellar protein levels (D–F) of proinflammatory markers TNF-α, IL-1β, and IL-6 using ELISA across different groups. Data are presented as M ± SD. One-way ANOVA with Tukey’s post hoc test was used to evaluate statistical significance between groups. Statistical significance is represented as ^^^p < 0.05 versus the control group, ###p < 0.05 versus the SLNPs group, and $$$p < 0.05 compared to the MSG group.
FIGURE 8
FIGURE 8
The IHC expression of caspase-3. (A,B) display negative immunopositive stained cells for control and SLNPs (n = 10). (C,D) depict moderate immunopositive staining in the granular cell layer for the MSG group (n = 10). (E,F) demonstrate negative immuno-positive staining cells in all cerebellum layers for MSG + SLNPs (n = 10). H and I illustrate the gene expression of Bax and Bcl-2. Image magnification is 100x, with the inset at 400x. Thin arrows indicate immunopositive stained cells. (G) Histogram of actual positive caspase-3 cells in positive area. (H,I) Gene expression of Bax and Bcl-2 in cerebellar samples from different groups. All data are introduced as M ± SD. Statistical analyses were conducted using one-way ANOVA, with subsequent Tukey’s post hoc testing to determine intergroup significance. Statistical significance is denoted as ^^^p < 0.05 in comparison to the control group ###p, #p < 0.05 in comparison to the SLNPs group, and $$p < 0.05 in comparison to the MSG group.
FIGURE 9
FIGURE 9
(A) The cerebellar protein level of BDNF by ELISA across different groups, (B) the gene expression of TrkB, and (C,D) the protein levels of p-PI3K and p-AKT. All data are represented as M ± SD. Statistical significance was evaluated by one-way ANOVA, followed by Tukey’s post hoc test for multiple comparisons. Statistical significance is denoted as ^^^p, ^^p < 0.05 versus the control group, ###p, ##p < 0.05 compared to the SLNPs group, and $$$p < 0.05 versus the MSG group.

Similar articles

References

    1. Abdel-Moneim A. M., Al-Kahtani M. A., El-Kersh M. A., Al-Omair M. A. (2015). Free radical-scavenging, anti-inflammatory/anti-fibrotic and hepatoprotective actions of taurine and silymarin against CCl4 induced rat liver damage. PLoS One 10 (12), e0144509. 10.1371/journal.pone.0144509 - DOI - PMC - PubMed
    1. Abu-Elfotuh K., Abdel-Sattar S. A., Abbas A. N., Mahran Y. F., Alshanwani A. R., Hamdan A. M. E., et al. (2022). The protective effect of thymoquinone Or/And thymol against monosodium glutamate-induced attention-deficit/hyperactivity disorder (ADHD)-Like behavior in rats: modulation of Nrf2/HO-1, TLR4/NF-κB/NLRP3/caspase-1 and Wnt/β-Catenin signaling pathways in rat model. Biomed.Pharmacother. 155, 113799. 10.1016/j.biopha.2022.113799 - DOI - PubMed
    1. Abu Lila A. S., Ishida T. (2017). Liposomal delivery systems: design optimization and current applications. Biol. Pharm. Bull. 40 (1), 1–10. 10.1248/bpb.b16-00624 - DOI - PubMed
    1. Aminuddin M., Partadiredja G., Sari D. C. (2015). The effects of Black garlic (Allium sativum L.) ethanol extract on the estimated total number of purkinje cells and motor coordination of Male adolescent wistar rats treated with monosodium glutamate. Anat. Sci. Int. 90 (2), 75–81. 10.1007/s12565-014-0233-2 - DOI - PubMed
    1. Arif W., Rana N. F., Saleem I., Tanweer T., Khan M. J., Alshareef S. A., et al. (2022). Antibacterial activity of dental composite with ciprofloxacin loaded silver nanoparticles. Molecules 27 (21), 7182. 10.3390/molecules27217182 - DOI - PMC - PubMed

LinkOut - more resources