. 2025 Jul 3:6:uqaf013.
doi: 10.1093/femsml/uqaf013. eCollection 2025.

Cas9-independent tracrRNA cytotoxicity in Lacticaseibacillus paracasei

Affiliations

Cas9-independent tracrRNA cytotoxicity in Lacticaseibacillus paracasei

Adini Q Arifah et al. Microlife. .

Abstract

CRISPR-Cas9 systems are widely used for bacterial genome editing, yet their heterologous expression has been associated with cytotoxicity. The Cas9 nuclease from Streptococcus pyogenes (SpyCas9) has been one common source, with reports of cytotoxicity with the nuclease alone or in combination with a single-guide RNA observed in some bacteria. However, the potential cytotoxic effects of other components of the CRISPR-Cas9 system remain unknown. Here, we report that expression of the short isoform of the trans-activating CRISPR RNA (tracr-S) from the S. pyogenes CRISPR-Cas locus is cytotoxic in Lacticaseibacillus paracasei, even in the absence of SpyCas9. Deleting a putative transcription regulator in L. paracasei alleviates tracr-S cytotoxicity and leads to expression of the long isoform of the trans-activating CRISPR RNA (tracr-L). Furthermore, cytotoxicity was specific to the tracr-S sequence and was linked to direct interactions with host RNAs. This work thus reveals that additional CRISPR components beyond Cas9 can interfere with the use of heterologous CRISPR-Cas systems in bacteria, with potential implications for the evolution of CRISPR immunity.

Keywords: CRISPR-Cas; Cas9; Lacticaseibacillus paracasei; Streptococcus pyogenes; cytotoxicity; tracrRNA.


Conflict of interest statement

C.L.B. is a co-founder and officer of Leopard Biosciences, co-founder and Scientific Advisor to Locus Biosciences, and Scientific Advisor to Benson Hill. The other authors declare no competing interests.

Figures

Figure 1.
Figure 1.
Plasmid-expressed tracrRNA from Streptococcus pyogenes Cas9 is cytotoxic in L. paracasei. (A) Overview of the CRISPR-Cas9 cassette from Streptococcus pyogenes integrated into an E. coli-Lactobacilli shuttle vector pJP005-ΔNisRK backbone for application in L. paracasei. The diagram depicts pCRISPR-Cas9 plasmid, which is a plasmid containing SpyCas9 and tracrRNA insert. (B) Illustrations of the plasmid constructs used in L. paracasei transformations, followed by a representative dilution plate and a CFU/µg graph representing the transformation efficiency. Darker shade represents normal size colonies, and lighter shade represents either smaller size colonies or mix sizes colonies indicating cytotoxicity. Individual dots for the transformations indicate a single biological replicate (n = 4).
Figure 2.
Figure 2.
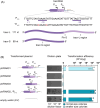
tracrRNA cytotoxicity is caused by the short isoform of tracrRNA. (A) The diagram depicts ptrRNA02 plasmid, which contains only tracrRNA and its promoters up to the −59 position. It highlights the locations of the Ptr-L and Ptr-S promoters and the location of the mutations introduced in *Ptr-L. The expected size of the tracr-S and tracr-L transcripts are indicated. (B) Illustrations of the plasmid constructs, followed by a representative of dilution plates and a CFU/µg graph representing the transformation efficiency of L. paracasei transformed with tracrRNA-related constructs. Darker shade represents normal size colonies, and lighter shade represents either smaller size colonies or mix size colonies indicating cytotoxicity. Each dot indicates a single biological replicate (n = 4). Data for ptrRNA01 and the EV transformations are identical as in Fig. 1B, as the experiments were performed in parallel.
Figure 3.
Figure 3.
Removal of the putative transcription regulator Peg.728 alleviates Cas9 and tracrRNA cytotoxicity. (A) Schematic illustration of the WGS process used to identify escaper colonies (E1, E2, E3) that survive the cytotoxicity of pCRISPR-Cas9, followed by deletion of peg.728 to generate Δpeg.728 mutant of L. paracasei to validate its importance in CRISPR-Cas9 cytotoxicity observed in L. paracasei. (B) Illustrations of the plasmid constructs, followed by a representative of dilution plates and a CFU/µg graph representing the transformation efficiency of L. paracasei wild-type and Δpeg.728 transformed with Cas9 and tracrRNA constructs as indicated. For each dilution plate image, the top bar shows the transformation of wild-type L. paracasei, and the bottom bar shows the transformation of Δpeg.728. Darker shade represents normal size colonies and lighter shade represents either smaller size colonies or mix size colonies indicating growth defects (n = 4). Data for wildtype transformations are identical as in Figs 1B and 2B, as the experiments were performed in parallel.
Figure 4.
Figure 4.
tracr-L expression is repressed via peg.728 in L. paracasei. (A) Northern blotting results of the wild-type and Δpeg.728 L. paracasei transformed with initial tracrRNA construct ptrRNA01. Three oligo probes were used to detect tracrRNA isoforms. Probe 1: binds at the anti-repeat to detect both tracr-S and tracr-L. Probe 2: binds at the promoter of tracr-S (at −1 up to −20 position of Ptr-S), to detect only tracr-L isoform. Probe 3: binds at the sequence after the poly-U tail stretch of tracrRNA intrinsic terminator to detect isoforms with 3′ end extension. The 5S rRNA was used as loading control. (B) Northern blotting results of the wild-type and Δpeg.728 L. paracasei transformed with tracrRNA construct with removed 5′ UTR of Cas9, leaving only upstream of Ptr-L up to −59 position and deactivated tracr-S promoter (ptrRNA02_*Ptr-S). Three oligo probes were used to detect tracrRNA isoforms. Probe 1: binds at the anti-repeat to detect tracr-S and tracr-L. Probe 4: binds at the 3′ end of the tracrRNA, which is the stem loop 3 region of tracr-S. Probe 5: binds at the tracr-L region. The 5S rRNA was used as loading control.
Figure 5.
Figure 5.
The cytotoxicity of tracr-S is sequence-dependent, involving the anti-repeat and nexus regions. (A) Schematic representation of the S. pyogenes tracr-S secondary structure, highlighting its major domains: anti-repeat (purple), nexus (brown), linker (blue), stem-loop 2 (orange), and stem-loop 3 (green). Below, sequence alignments show wildtype tracr-S, a chimeric version with the anti-repeat and nexus replaced with tracrRNA sequence from L. rhamnosus (tr-SΔ1,2:: Lrh), and a version where the entire tracr-S is replaced by the L. rhamnosus tracrRNA while retaining the native promoter (Δtr-S:: Lrh). Sequences shared across all three variants are marked with asterix. (B) Schematic illustration of tracr-S and the deletions or chimeric modifications introduced into its sequence. Shown alongside are representative dilution plates and a CFU/µg DNA graph indicating transformation efficiency in wild-type and Δpeg.728 L. paracasei strains transformed with the indicated plasmids. For each dilution plate image, the top bar shows the transformation of wild-type L. paracasei, and the bottom bar shows the transformation of Δpeg.728. Darker shade represents normal size colonies and lighter shade represents either smaller size colonies or mix size colonies indicating growth defects (n = 4). Data for ptrRNA03 and EV transformations are identical as in Fig. 3B, as the experiments were performed in parallel.
Figure 6.
Figure 6.
The tracrRNA interacts with cellular RNAs in L. paracasei. (A) The experimental setup of MS2-aptamer affinity purification coupled with sequencing (MAPS) to obtain tracrRNA interacting cellular RNAs. (B) Quality control of MAPS samples by Northern blotting analysis of wild-type L. paracasei carrying EV, plasmid containing tracrRNA (ptrRNA01), plasmid containing ptrRNA01_MS2 where MS2-aptamer was fused to tracrRNA by replacing the stem-loop 2 and 3, and plasmid containing MS2 aptamer under tracrRNA promoter. “I” indicates the input samples before pulldown, and “P” indicates samples after pulldown. Probe 1 binds at the anti-repeat, probe 6 binds at the MS2 aptamer region, and 5S rRNA probe was used to detect the loading control. (C) Volcano plot showing the differential abundance of RNAs in the MAPS experiment compared to controls. Each point represents an RNA, with the x-axis indicating log2 fold-change (FC) and the y-axis showing −log10 (adjusted P-value). The threshold for enriched RNAs is set at FC > 1.5 (dotted line). RNAs significantly enriched in the pulldown appear in the upper right, while depleted RNAs are in the upper left. Non-significant RNAs cluster near the center. Turquoise points represent RNAs above the FC threshold, labeled with SEED gene identifiers, highlighting those most abundant in the pulldown sample and potentially interacting with the bait tracrRNA-MS2. Gene descriptions corresponding to these identifiers are provided in Table S5. (D) Genome browser (IGB) view of mapped reads from the tracrRNA-MS2 pulldown experiment across five enriched target RNAs (radC, peg.148, peg.727, peg.1813, peg.1758), shown alongside IntaRNA-predicted interaction profiles. Read coverage tracks are displayed for four conditions: EV, tracrRNA (ptrRNA01), MS2-tagged tracrRNA (ptrRNA01_MS2), and MS2 aptamer alone (pMS2). Below each coverage plot, heatmaps represent interaction energies (minimal free energy, MFE in kcal/mol) reflecting the sum of hybridization energy and unfolding energies in both RNAs between tracr-S and each target transcript. The horizontal axis shows the position along each target RNA (including 250 bp upstream and downstream of the coding sequence), and the vertical axis shows positions along tracr-S (nucleotides 1–89). Stronger predicted interactions (lower MFE) are shown in darker shades. At the bottom is the top-ranked IntaRNA-predicted interaction for each target, including where it localized, base-pairing models, and the corresponding MFE. Interacting regions of tracr-S are highlighted. Gene models are annotated with gene identifiers.

Similar articles

References

    1. Adli M. The CRISPR tool kit for genome editing and beyond. Nat Commun. 2018;9:1911. 10.1038/s41467-018-04252-2. - DOI - PMC - PubMed
    1. Altschul SF, Gish W, Miller W et al. Basic local alignment search tool. J Mol Biol. 1990;215:403–10. 10.1016/S0022-2836(05)80360-2. - DOI - PubMed
    1. Andrews S. Fastqc: A Quality Control Tool for High Throughput Sequence Data. Cambridge, United Kingdom, 2010. http://www.bioinformatics.babraham.ac.uk/projects/fastqc.
    1. Aravind L, Anantharaman V, Balaji S et al. The many faces of the helix-turn-helix domain: transcription regulation and beyond. FEMS Microbiol Rev. 2005;29:231–62. 10.1016/j.femsre.2004.12.008. - DOI - PubMed
    1. Arroyo-Olarte RD, Rodríguez RB, Morales-Ríos E. Genome editing in bacteria: CRISPR-Cas and beyond. Microorganisms. 2021;9:844. 10.3390/microorganisms9040844. - DOI - PMC - PubMed

LinkOut - more resources