. 2025 Jul 28;9(7):e70176.
doi: 10.1002/hem3.70176. eCollection 2025 Jul.

Ex vivo drug responses and molecular profiles of 597 pediatric acute lymphoblastic leukemia patients

Affiliations

Ex vivo drug responses and molecular profiles of 597 pediatric acute lymphoblastic leukemia patients

Anna Pia Enblad et al. Hemasphere. .

Erratum in

Abstract

Ex vivo drug response profiling is emerging as a valuable tool for identifying drug resistance mechanisms and advancing precision medicine in hematological cancers. However, the functional impact of dysregulation of the epigenome and transcriptome in this context remains poorly understood. In this study, we combined ex vivo drug sensitivity profiling with transcriptomic and epigenomic analyses in diagnostic samples from 597 pediatric B-cell precursor acute lymphoblastic leukemia (BCP-ALL) patients. Ex vivo resistance to antimetabolites (e.g., cytarabine, thioguanine), glucocorticoids (e.g., dexamethasone, prednisolone), and doxorubicin was independently associated with reduced relapse-free survival (P < 0.05). Molecular profiling identified pretreatment DNA methylation and gene expression patterns distinguishing resistant from sensitive cases, revealing key drug resistance signatures. These included aberrant expression of genes related to heme metabolism (e.g., ATPV06A) and KRAS signaling (e.g., GS02). Notably, we also observed atypical expression of genes usually restricted to T cells and other immune cells (e.g., ITK) in resistant BCP-ALL cells. Our findings demonstrate that ex vivo drug response patterns are predictive of clinical outcomes and reflect intrinsic molecular states associated with drug tolerance. This integrative multi-omics approach highlights potential therapeutic targets and underscores the value of functional precision medicine in identifying treatment vulnerabilities in pediatric ALL.


Conflict of interest statement

The authors declare that they have no conflicts of interest.

Figures
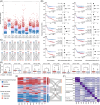
Figure 1
Figure 1
Ex vivo drug response and clinical outcome in pediatric B‐cell precursor acute lymphoblastic leukemia patients. (A) SI% distribution (y‐axis) per drug (x‐axis). The patients are color‐coded by their ex vivo drug response group (sensitive, intermediate, and resistant). (B) Kaplan–Meier curves depicting relapse‐free survival, with patients stratified by the ex vivo drug response groups (sensitive, intermediate, or resistant), P‐values calculated using log‐rank test. Forest plots showing hazard ratio and 95% confidence interval for relapse in groups with different ex vivo drug response, adjusted for sex and risk group. (C) Relationship between the distribution of patients in different ex vivo drug response groups and the different clinical risk groups (D) SI% by drug (y‐axis) for relapses versus no relapses (x‐axis). Mann‐Whitney P‐values: ***<0.001, **<0.01, and *<0.05. (E) Unsupervised hierarchical clustering of patients based on ex vivo drug response to the 10 individual drugs, rendering three main clusters deemed multidrug sensitive, intermediate, and resistant (left). Relationship between the distribution of patients in different levels of ex vivo multidrug response and the different clinical risk groups (right). (F) Correlation plot displaying the Spearman's rank correlation coefficient pairwise between different drugs, to assess the relationship between drug responses. Ams, amsacrine; asp, l‐asparaginase; cyta, cytarabine; dexa, dexamethasone; doxo, doxorubicin; eto, etoposide; mito, mitoxantrone; pred, prednisolone; thio, thioguanine; vcr, vincristine.
Figure 2
Figure 2
Molecular profiles related to ex vivo drug responses. (A) Numbers of differentially methylated CpG sites (DMCs) per drug, with total numbers indicated in parentheses and number of hypo‐ and hypermethylated CpG sites shown left and right of the bar graph. Number of cases included in the analysis per drug: dexa n = 288, pred n = 289, cyta n = 244, thio n = 288, doxo n = 278, ams n = 280, eto n = 262, mito n = 236, asp n = 149, and vcr n = 270. (B) Pairwise comparison between drugs displaying the number of overlapping DMCs between drugs, colored according to percentage of DMCs overlapping. (C) Numbers of differentially expressed genes (DEGs) per drug, with total numbers indicated in parentheses and number of downregulated and overexpressed genes shown left and right of the bar graph. Number of cases included in the analysis per drug: dexa n = 85, pred n = 78, cyta n = 70, thio n = 76, doxo n = 87, ams n = 83, eto n = 80, mito n = 62, asp n = 50, and vcr n = 76. (D) Pairwise comparison between drugs displaying the number of overlapping DEGs between drugs, colored according to percentage of DEGs overlapping. Ams, amsacrine; asp, l‐asparaginase; cyta, cytarabine; dexa, dexamethasone; doxo, doxorubicin; eto, etoposide; mito, mitoxantrone; pred, prednisolone; thio, thioguanine; vcr, vincristine.
Figure 3
Figure 3
Pathways priming resistance in B‐cell precursor acute lymphoblastic leukemia. (A) The top three most significantly enriched pathways in ex vivo resistant samples per drug (lowest false discovery rate [FDR]‐adjusted P‐value) and, in case of the same pathways being found for other drugs, this is also displayed, even if it was not in the top three most significantly enriched pathways for that drug. Round shape indicates that the pathway was related to differentially methylated CpG sites (DMCs), and triangle shape indicates that the pathway was associated with genes related to differentially expressed genes (DEGs). Size indicates how many genes were enriched to each pathway, colored according to the −log10 FDR score. (B) Heatmaps showing the different expression levels of genes (log2 expression) related to heme metabolism and (C) T‐cell pathways (bottom), between glucocorticoid (dexamethasone and prednisolone) resistant and sensitive patients. Ams, amsacrine; dexa, dexamethasone; doxo, doxorubicin; eto, etoposide; mito, mitoxantrone; pred, prednisolone; thio, thioguanine; vcr, vincristine.
Figure 4
Figure 4
Single‐cell (sc) profiling of pediatric B‐cell precursor acute lymphoblastic leukemia samples (A) sc‐UMAP plot color‐coded by patient ID. (B) sc‐UMAP plot colored by cell linage. (C) Uniform manifold approximation and projection (UMAP) plots demonstrating gene‐specific expression for ABCB1 and genes involved in KRAS (G0S2), heme (OSBP2, ATP6V0A1), and T‐cell‐related pathways (ITK and TXK).

References

    1. Pui CH, Pei D, Coustan‐Smith E, et al. Clinical utility of sequential minimal residual disease measurements in the context of risk‐based therapy in childhood acute lymphoblastic leukaemia: a prospective study. Lancet Oncol. 2015;16(4):465‐474. 10.1016/S1470-2045(15)70082-3 - DOI - PMC - PubMed
    1. Toft N, Birgens H, Abrahamsson J, et al. Results of NOPHO ALL2008 treatment for patients aged 1–45 years with acute lymphoblastic leukemia. Leukemia. 2018;32(3):606‐615. 10.1038/leu.2017.265 - DOI - PubMed
    1. Oskarsson T, Soderhall S, Arvidson J, et al. Relapsed childhood acute lymphoblastic leukemia in the Nordic countries: prognostic factors, treatment and outcome. Haematologica. 2016;101(1):68‐76. 10.3324/haematol.2015.131680 - DOI - PMC - PubMed
    1. Maloney KW, Devidas M, Wang C, et al. Outcome in children with standard‐risk B‐cell acute lymphoblastic leukemia: results of Children's Oncology Group trial AALL0331. J Clin Oncol. 2020;38(6):602‐612. 10.1200/JCO.19.01086 - DOI - PMC - PubMed
    1. Toft N, Birgens H, Abrahamsson J, et al. Toxicity profile and treatment delays in NOPHO ALL2008‐comparing adults and children with Philadelphia chromosome‐negative acute lymphoblastic leukemia. Eur J Haematol. 2016;96(2):160‐169. 10.1111/ejh.12562 - DOI - PubMed

LinkOut - more resources