. 2025 Aug;169(8):e70175.
doi: 10.1111/jnc.70175.

Orexin/Hypocretin Modulates Neuroinflammatory Response to LPS in a Sex and Brain-Region Specific Manner in Young Rats

Affiliations

Orexin/Hypocretin Modulates Neuroinflammatory Response to LPS in a Sex and Brain-Region Specific Manner in Young Rats

M A Frick et al. J Neurochem. 2025 Aug.

Abstract

Neuroinflammation has emerged as a contributing mechanism in age-related cognitive decline (ARCD), Parkinson's disease (PD), obesity, sleep disorders, and autoimmune disorders. Orexin/hypocretin, a neuropeptide expressed in the lateral hypothalamus (LH), has well-established roles in homeostatic processes, such as energy metabolism, food intake, sleep, and wakefulness. Our laboratory and others have shown that orexin expression decreases with age, and this age-related orexin decline is exacerbated in disease states. Additionally, it has recently been shown that orexin possesses anti-inflammatory and neuroprotective properties. Based on these observations, we hypothesize that orexin is modulating neuroinflammation in brain regions that are critical in the development of ARCD. To test this hypothesis, we used lentiviral gene transfer to downregulate orexin expression in male and female young rats to mimic age-related orexin deficiency and examined neuroinflammatory responses to peripheral administration of lipopolysaccharide (LPS). We found a significant reduction of basal forebrain (BF) microglial complexity and plasma BDNF in both males and females following orexin downregulation. Notably, orexin downregulation blocked the capacity of the neuroinflammatory system to respond to LPS. These results demonstrate that neuroinflammatory responses are dependent on orexin signaling, and this system becomes dysfunctional in aging in a sex-dependent manner.

Keywords: aging; brain‐derived neurotrophic factor; cytokines; microglia; orexin/hypocretin.


Conflict of interest statement

The authors declare no conflicts of interest.

Figures

FIGURE 1
FIGURE 1
Orexin‐Antisense significantly reduced orexin‐positive cells in the LH of young male and female rats. All lentiviruses were constructed in the University of South Carolina School of Medicine Viral Vector Core Facility and contained the rat PPOX cDNA inserted in the antisense orientation and control transgene expression cassettes under a phosphoglycerate kinase‐1 (pgk‐1) promoter. Orexin was visually represented using a mouse anti‐orexin antibody (see Methods section for further details). Orexin‐positive cells were localized to the LH using the fornix (f) as a significant landmark. Since the LH is the only location of orexin synthesis, we analyzed orexin expression in this area following control virus or antisense virus administration. Orexin‐positive cells were manually counted from 3 representative sections of LH tissue and then averaged for each animal. Representative images were obtained at 10× magnification from an animal that received control virus (A) and orexin‐antisense virus (B). cFos positive cells are stained black, orexin‐positive cells are stained brown. (C) There was a significant reduction in orexin‐positive cells following orexin antisense in both males (p < 0.0001) and females (p = 0.001). Significance was determined with two‐way ANOVA with multiple comparisons (F(1,67) = 53.93; p < 0.0001). There were no animals removed following validation of lentiviral efficacy. Each circle indicates each individual control animal, while each triangle represents each individual orexin‐antisense animal. Male control, n = 12; female control, n = 13; male antisense, n = 22; female antisense, n = 24; blue bars indicate control virus, red bars indicate antisense virus. Recurrent statistical symbols correlate with p‐value. The researcher who conducted all analysis of orexin expression was blinded to experimental conditions, including virus and sex.
FIGURE 2
FIGURE 2
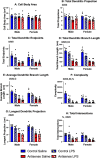
Representative images of microglial 3D reconstructions for Sholl analysis in the BF from an animal that received control virus (A) and orexin‐antisense virus (B). Six randomly selected, representative microglia were manually traced from the BF and 3D reconstructed using Neurolucida. The representative microglia were averaged together for each animal, resulting in 6–11 per group. Sholl analysis was calculated by analyzing the number of dendritic intersections per each concentric circle with successive 5‐μm radial increases surrounding the microglial cell body. Dendritic analysis was also calculated using Neurolucida and generated the following measures: cell body area, total dendritic projections, total dendritic endpoints, total dendritic branch length, average dendritic branch length, complexity, longest dendritic projection, and total intersections (See Figure 4.) The researcher who conducted all microglial tracings and analysis was blinded to experimental conditions, including virus, treatment, and sex.
FIGURE 3
FIGURE 3
Orexin Antisense significantly altered Sholl analysis in the BF of males and females. Sholl analysis was calculated by analyzing the number of microglial dendritic intersections per 5‐μm concentric circles surrounding the cell body. Sholl analysis is presented as radial distance from the soma on the x‐axis and number of intersections per radius on the y‐axis. (A) In male controls, there was a reduction in intersections following LPS injection, indicating a change in microglial morphology in response to an immune challenge. Following orexin antisense, there was a significant decrease in intersections with no effect of LPS. (B) The same effect was seen in the females: there was a reduction in intersections following LPS injection in control females. Orexin antisense significantly reduced microglial intersections/radius with no effect of LPS. $ displayed on graph indicates significant difference when compared to control saline. Significance was determined according to one‐way ANOVA with multiple comparisons for each individual radius. All p‐values according to one‐way ANOVA are summarized in the provided table (C). –indicates no significant difference. Male control saline, n = 7; male control LPS, n = 7; male antisense saline, n = 9; male antisense LPS, n = 7; female control saline, n = 6; female control LPS, n = 7; female antisense saline, n = 11; female antisense LPS, n = 9. The experimenter was blind to all conditions.
FIGURE 4
FIGURE 4
Orexin antisense significantly reduced various measures of microglial dendritic analysis. Following microglial tracing and 3D reconstructed as previously described, various dendritic measures were calculated. There was a significant effect of orexin antisense on total dendritic projections (B, p < 0.0001, F (1, 55) = 18.34), total dendritic endpoints (C, p < 0.0001, F (1, 56) = 104.4), total dendritic projection length (D, p < 0.0001, F(1, 56) = 151.7), average dendritic projection length (E, p < 0.0001, F(1, 55) = 89.24), complexity (F, p < 0.0001, F(1, 54) = 89.14), longest dendritic projection length (G, p < 0.0001, F(1, 55) = 90.1), total intersections (H, p < 0.0001, F(1, 56) = 76.86) in both males and females. Additionally, there was a significant effect of sex on microglial complexity (p = 0.04, F(1, 54) = 4.3) and total intersections (p = 0.02, F(1, 56) = 5.375). There was a significant effect of LPS treatment on microglial complexity (p = 0.002, F(1, 54) = 10.05), average dendritic branch length (p = 0.002, F(1, 55) = 5.793), and total dendritic branch length (p = 0.008, F(1, 56) = 2.093). Microglial analysis was performed 6 h following LPS injection (1 mg/kg dose). There was no effect of sex, virus, or LPS administration on cell body area (A). Male control saline, n = 7; male control LPS, n = 7; male antisense saline, n = 9; male antisense LPS, n = 7; female control saline, n = 6; female control LPS, n = 7; female antisense saline, n = 11; female antisense LPS, n = 9. # displayed on graph indicates significant effect of virus, $ indicates significant effect of treatment, and % indicates significant effect of sex. Recurrent significance symbols correlate with p‐value. The experimenter was blind to all conditions.
FIGURE 5
FIGURE 5
LPS appropriately stimulated an immune response in the plasma 1‐h and 6‐h following administration. Cytokine concentration in plasma was measured using tail blood collected 1‐h following LPS administration and trunk blood collected 6‐h following LPS. Cytokine concentration was analyzed using a Bio‐Plex 12‐Plex assay according to the manufacturer's instructions. (A) LPS significantly increased TNF‐a (p = 0.001, F(1, 24) = 13.7) in the plasma 1 h following i.p. injection with no significant effect of sex or virus. (B) LPS significantly increased IL‐6 (p = 0.0002, F(1, 49) = 16.4) in the plasma 6 h post‐i.p. injection with no effect of sex or virus. Male control saline, n = 5; male control LPS, n = 5; male antisense saline, n = 4; male antisense LPS, n = 4; female control saline, n = 3; female control LPS, n = 4; female antisense saline, n = 3; female antisense LPS, n = 4. $ displayed on graph indicates significant effect of virus according to three‐way ANOVA. Recurrent significance symbols correlate with p‐values. The experimenters were blind to treatment and sex.
FIGURE 6
FIGURE 6
Orexin antisense reduces the capacity of the cytokine response to LPS in a brain‐region and sex‐specific manner. Cytokine concentration in brain microdissections were measured using Bio‐Plex 12‐Plex assay 6 h following LPS administration. Cytokine concentration was normalized to protein content for each animal. In the LH, there was a significant increase in IL‐1α (A, p = 0.0002) and IL‐1β (B) to LPS in the control males and females. Following orexin downregulation, there was no effect of LPS in the males and females. According to three‐way ANOVA, there was a significant effect of virus and treatment for both IL‐1α (virus, p < 0.0001, F(1, 49) = 18.63; Treatment, p = 0.0002, F(1, 49) = 15.72) and IL‐1β (virus, p < 0.0001, F(1, 48) = 19.96; Treatment, p = 0.0002, F(1, 48) = 16.6). Additionally, females had a significantly higher IL‐12 response compared to the males in the LH with no effect of virus or treatment (C, p = 0.0004, F(1, 49) = 14.53). Females had significantly higher IL‐10 (D, p = 0.0004, F(1, 49) = 14.57) and IL‐13 (E, p = 0.0004, F(1, 51) = 14.13) in the BF compared to their male counterparts with no effect of virus or treatment. There was no change in IL‐12 in the BF following virus or LPS administration in either males or females (F). In the PFC, males elicited no IL‐1α (G), IL‐1β (H), or IL‐12 (I) response to virus or treatment. However, females had a significant increase in IL‐1α (G, p = 0.04, F(1, 45) = 4.441) and IL‐1β (H, p = 0.014, F(1, 46) = 6.457) to LPS administration and this effect was blocked with orexin downregulation. There was no significant effect of LPS on IL‐12 (I) in the PFC of females. N sizes ranged from 5 to 12/group. All analyses were conducted using three‐way ANOVA and the p‐value was 0.05. # displayed on the graph indicates significant effect of virus, $ indicates significant effect of treatment, and % indicates significant effect of sex. Recurrent statistical symbols correlate with p‐values. The experimenters were blind to treatment and sex.
FIGURE 7
FIGURE 7
LPS and Orexin antisense significantly reduced plasma BDNF. BDNF was analyzed using plasma collected 6 h following LPS administration on a BDNF ELISA according to the manufacturer's instructions. Following LPS, there was a significant reduction in BDNF in the control males and females (p = 0.002, F(1, 58) = 10.07). Following orexin downregulation, there was a significant decrease in BDNF expression when compared to control saline animals (p < 0.0001, F(1, 58) = 19.54). There was no effect of LPS seen in orexin antisense animals. Additionally, there was no significant effect of sex on BDNF expression. All analyses were conducted using three‐way ANOVA. p‐value < 0.05. Male control saline, n = 7; male control LPS, n = 7; male antisense saline, n = 11; male antisense LPS, n = 12; female control saline, n = 7; female control LPS, n = 6; female antisense saline, n = 8; female antisense LPS, n = 8. # displayed on graph indicates significant effect of virus, and $ indicates significant effect of treatment. Recurrent statistical symbols correlate with p‐values. The experimenter was blind to treatment and sex.
FIGURE 8
FIGURE 8
Summary table of all findings. Orexin antisense significantly decreased orexin expression in the LH of both males and females. This downregulation of orexin had significant effects on BF microglial morphology, LH and PFC cytokines, and BDNF. We identified significant sex differences in BF microglial complexity and observed elevations in female cytokines and CORT. There were significant effects of an immune challenge (LPS) on microglial morphology, central and peripheral cytokines, BDNF, and CORT. In conclusion, we have identified orexin as a key modulatory factor in neuroinflammatory responses that are sex, brain‐region, and cytokine specific.

References

    1. Altena, E. , Ramautar J. R., Van Der Werf Y. D., and Van Someren E. J.. 2010. “Do Sleep Complaints Contribute to Age‐Related Cognitive Decline?” Progress in Brain Research 185: 181–205. 10.1016/b978-0-444-53702-7.00011-7. - DOI - PubMed
    1. An, H. , Cho M. H., Kim D. H., Chung S., and Yoon S. Y.. 2017. “Orexin Impairs the Phagocytosis and Degradation of Amyloid‐β Fibrils by Microglial Cells.” Journal of Alzheimer's Disease 58, no. 1: 253–261. 10.3233/jad-170108. - DOI - PubMed
    1. Ashdown, H. , Poole S., Boksa P., and Luheshi G. N.. 2007. “Interleukin‐1 Receptor Antagonist as a Modulator of Gender Differences in the Febrile Response to Lipopolysaccharide in Rats.” American Journal of Physiology. Regulatory, Integrative and Comparative Physiology 292, no. 4: R1667–R1674. 10.1152/ajpregu.00274.2006. - DOI - PubMed
    1. Aston‐Jones, G. , Smith R. J., Sartor G. C., et al. 2010. “Lateral Hypothalamic Orexin/Hypocretin Neurons: A Role in Reward‐SEEKING AND ADdiction.” Brain Research 1314: 74–90. 10.1016/j.brainres.2009.09.106. - DOI - PMC - PubMed
    1. Calva, C. B. , Fayyaz H., and Fadel J. R.. 2018. “Increased Acetylcholine and Glutamate Efflux in the Prefrontal Cortex Following Intranasal Orexin‐A (Hypocretin‐1).” Journal of Neurochemistry 145, no. 3: 232–244. 10.1111/jnc.14279. - DOI - PMC - PubMed

LinkOut - more resources