. 2025 Aug;7(8):e70070.
doi: 10.1002/acr2.70070.

Associations of Lymphocyte Subpopulations, Related Cytokines, Clinical Phenotypes, and Outcomes in Systemic Juvenile Idiopathic Arthritis

Affiliations

Associations of Lymphocyte Subpopulations, Related Cytokines, Clinical Phenotypes, and Outcomes in Systemic Juvenile Idiopathic Arthritis

Butsabong Lerkvaleekul et al. ACR Open Rheumatol. 2025 Aug.

Abstract

Objective: To facilitate appropriate management, we aimed to evaluate associations between lymphocyte subsets and related cytokines with clinical characteristics and treatment outcomes of patients with systemic juvenile idiopathic arthritis (sJIA).

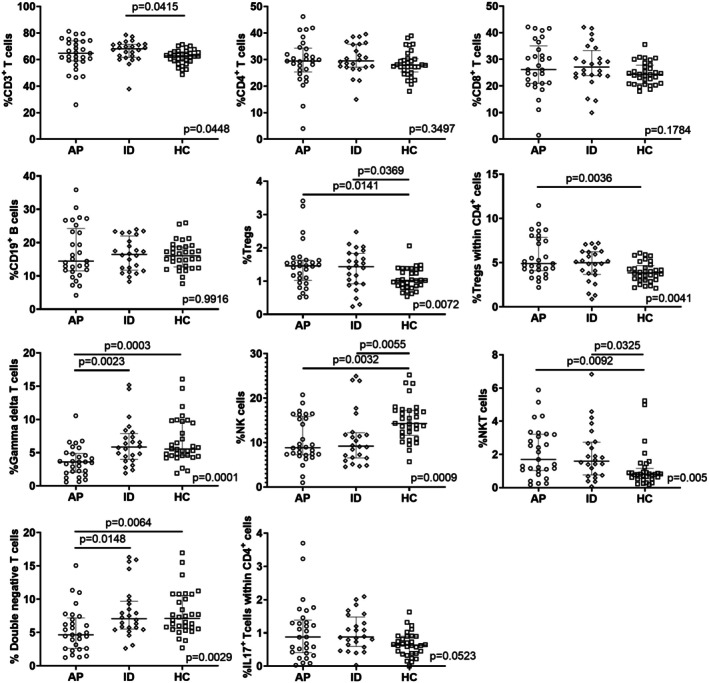
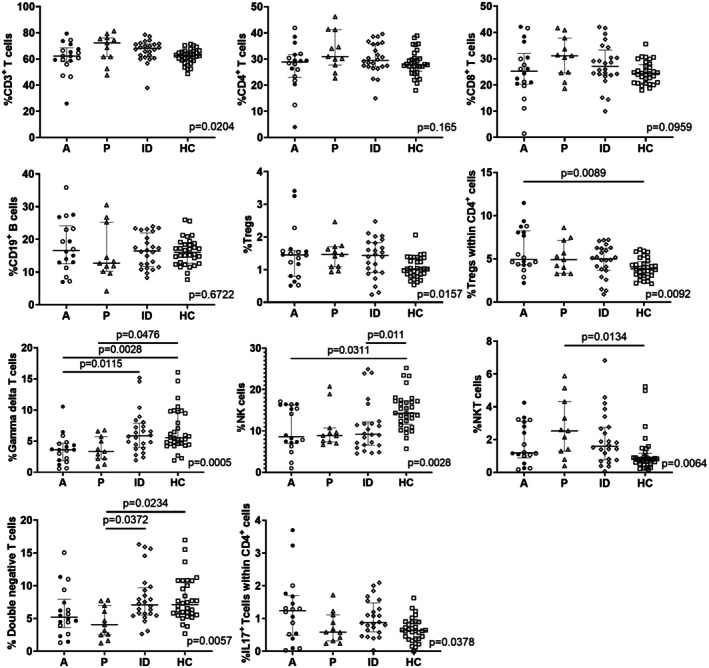
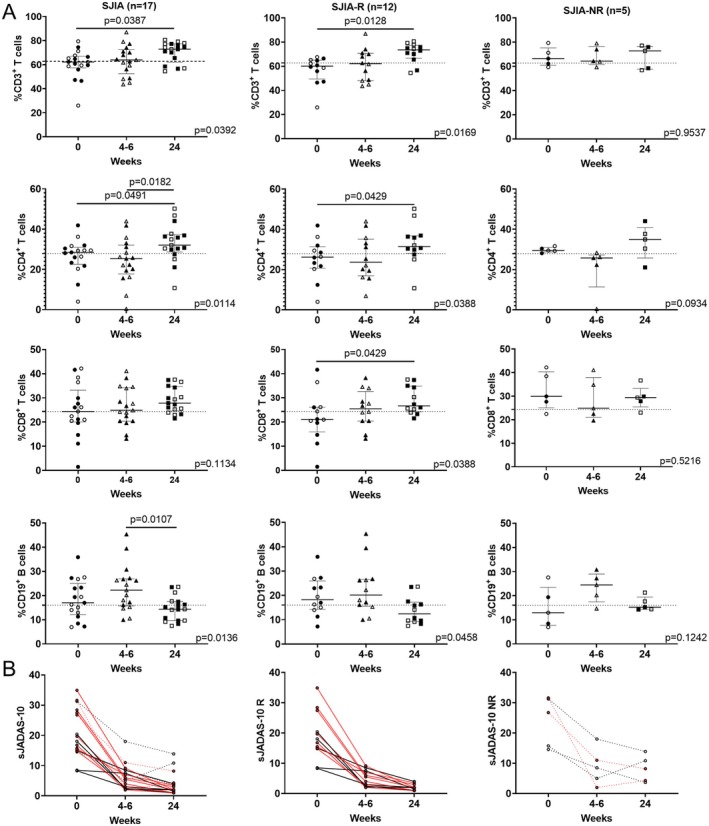
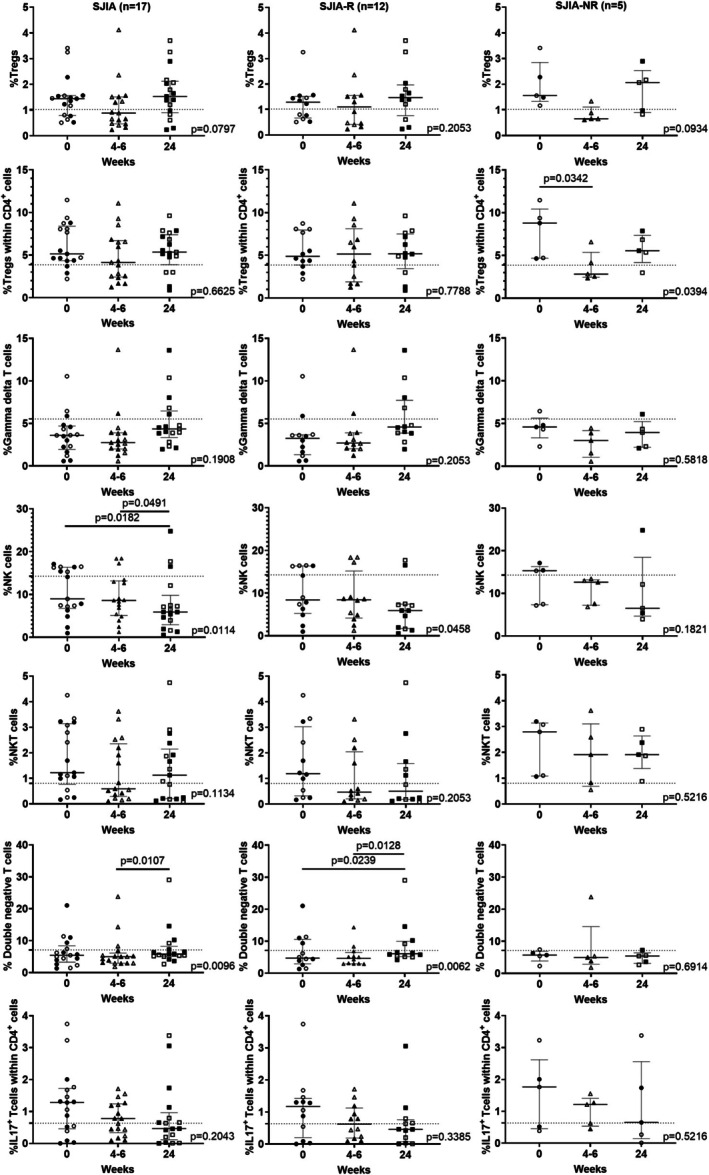
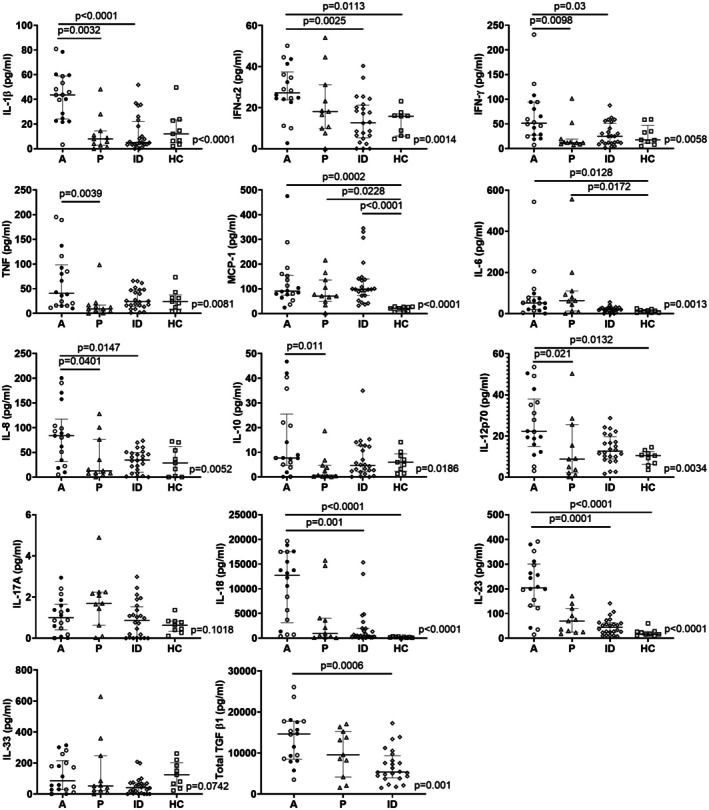
Methods: We collected blood samples from 53 patients with sJIA and evaluated the percentages of lymphocyte subsets and cytokine levels. Patients were categorized into active (n = 18), persistent (n = 11), and inactive (n = 24) sJIA groups based on clinical phenotypes. Seventeen patients with active disease provided longitudinal blood samples at 0, 4 to 6, and 24 weeks. Among these patients, 12 patients were classified as sJIA treatment responders (sJIA-R) and 5 patients were classified as sJIA treatment nonresponders (sJIA-NR). The healthy control (HC) group comprised 32 age-matched children.

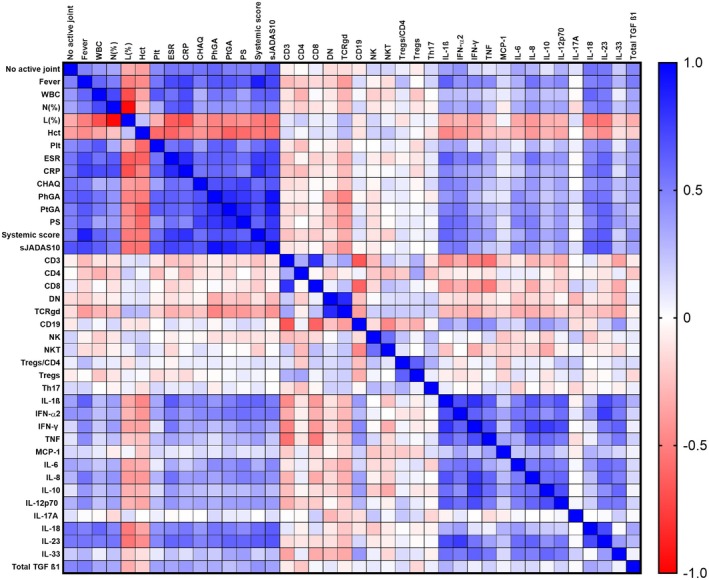
Results: Dynamic changes in lymphocyte subsets and cytokine levels were observed over time. In the longitudinal cohort, patients in the sJIA-R group showed a significant decline in proinflammatory cytokines, including interleukin-1 (IL-1), interferon-γ (IFN-γ), monocyte chemoattractant protein-1, and IL-23, along with increases in CD3+, CD4+, and CD8+ T cells. In contrast, patients in the sJIA-NR group had persistently elevated IL-1, IL-23, and tumor necrosis factor levels and natural killer (NK) T cell percentages. Despite clinical improvement, IL-18 and IFN-γ levels remained elevated compared to HCs throughout the 24-week follow-up. Analysis of minor lymphocyte subsets revealed low NK and gamma delta (γδ) T cell percentages during active disease and follow-up. Notably, IL-23 levels and γδ T cell percentages were significantly associated with several disease activity parameters.

Conclusion: Patients with sJIA exhibit altered lymphocyte subsets and inflammatory mediator production during the disease course, which may assist in identifying treatment responders and guiding therapeutic strategies. This study investigated associations of lymphocyte subpopulations, related cytokines, clinical phenotypes, and outcomes in systemic juvenile idiopathic (sJIA). Low percentages of NK and γδ-T cells were observed in patients with sJIA, particularly during active disease, compared to healthy controls. Persistent elevations in IL-1, IL-23, TNF, and NK T cell percentage were associated with poor treatment response.


Figures

Figure 1
Figure 1
The percentages of lymphocyte subsets among active and persistent sJIA, inactive sJIA, and HCs. The data included 53 patients with sJIA (AP, combined patients in the active group [n = 18] and the persistent group [n = 11]; patients in the ID group [n = 24]) and 32 age‐matched HCs. Horizontal solid lines represent medians and interquartile ranges. AP, active and persistent; HC, healthy control; ID, inactive; IL‐17, interleukin‐17; NK, natural killer; NKT, natural killer T; sJIA, systemic juvenile idiopathic arthritis; Treg, regulatory T.
Figure 2
Figure 2
The percentages of lymphocyte subsets among patients in each clinical phenotype and HCs. The data included 18 patients with active sJIA, 11 patients with persistent sJIA, 24 patients with inactive sJIA, and 32 age‐matched HCs. Horizontal solid lines represent medians and interquartile ranges. The black circle represents naïve to treatment in patients with active sJIA, and the white circle represents patients with active sJIA receiving treatment. AP, active and persistent; HC, healthy control; ID, inactive; IL‐17, interleukin‐17; NK, natural killer; NKT, natural killer T; sJIA, systemic juvenile idiopathic arthritis; Treg, regulatory T.
Figure 3
Figure 3
The percentages of main lymphocyte subset distribution and disease activity during the longitudinal follow‐up of patients with sJIA between the responder (sJIA‐R) and the nonresponder (sJIA‐NR) groups. (A) The percentages of the main lymphocyte subsets during the six‐month follow‐up period. (B) The disease activity measured by sJADAS‐10 during the six‐month follow‐up period. The black circles, triangles, and squares in panel A represent individuals without initial treatment. The white circles, triangles, and squares in panel A represent individuals with initial treatment. The horizontal solid lines in panel A represent medians and interquartile ranges. The dashed horizontal lines in panel A depict the median values for healthy controls. The solid lines in panel B represent individual responders. The dashed lines in panel B represent individual nonresponders. The red lines in panel B represent individuals without treatment. The black lines in panel B represent individuals with treatment. sJIA, systemic juvenile idiopathic arthritis; sJIA‐NR, systemic juvenile idiopathic arthritis treatment nonresponders; sJIA‐R, systemic juvenile idiopathic arthritis treatment responders; sJADAS, systemic Juvenile Arthritis Disease Activity Score.
Figure 4
Figure 4
The percentages of minor lymphocyte subpopulation distribution during the longitudinal follow‐up of patients with sJIA between the responder (sJIA‐R) and the nonresponder (sJIA‐NR) groups. The black circles, triangles, and squares represent individuals without initial treatment. The white circles, triangles, and squares represent individuals with initial treatment. The horizontal solid lines represent medians and interquartile ranges. The dashed horizontal lines depict the median values for healthy controls. NK, natural killer; NKT, natural killer T; sJIA, systemic juvenile idiopathic arthritis; sJIA‐NR, systemic juvenile idiopathic arthritis treatment nonresponders; sJIA‐R, systemic juvenile idiopathic arthritis treatment responders; Treg, regulatory T.
Figure 5
Figure 5
The differences in cytokine profiles between each clinical phenotype and HCs. The data included 18 patients with active sJIA, 11 patients with persistent sJIA, 24 patients with inactive sJIA, and 9 age‐matched HCs. Horizontal solid lines showed medians and interquartile ranges. The black circles represent naïve to treatment in patients with active sJIA. The white circles represent patients with active sJIA receiving treatment. AP, active and persistent; HC, healthy control; ID, inactive; IFN‐α2, interferon‐α2; IL‐1β, interleukin‐1β; MCP‐1, monocyte chemoattractant protein 1; sJIA, systemic juvenile idiopathic arthritis; TGF β1, transforming growth factor β1; TNF, tumor necrosis factor.
Figure 6
Figure 6
Spearman's rank correlations among the percentages of lymphocyte subsets, the cytokine levels, clinical features, basic laboratory tests, and disease activity scores. CHAQ, Childhood Health Assessment Questionnaire; CRP, C‐reactive protein; DN, double‐negative T; ESR, erythrocyte sedimentation rate; Hct, hematocrit; IFN‐α2, interferon‐α2; IL‐1β, interleukin‐1β; L, lymphocytes; MCP‐1, monocyte chemoattractant protein 1; N, neutrophils; NK, natural killer; NKT, natural killer T; No. active joint, number of active joints; PGA, Physician Global Assessment; PS, pain score; PtGA, patient global assessment of disease activity; sJADAS, Systemic Juvenile Arthritis Disease Activity Score; TGF β1, transforming growth factor β1; TNF, tumor necrosis factor; Treg, regulatory T; WBC, white blood cell.

Similar articles

References

    1. Schulert GS, Kessel C. Molecular pathways in the pathogenesis of systemic juvenile idiopathic arthritis. Rheum Dis Clin North Am 2023;49(4):895–911. - PubMed
    1. Ombrello MJ, Arthur VL, Remmers EF, et al; British Society of Pediatric and Adolescent Rheumatology (BSPAR) Study Group, Inception Cohort of Newly Diagnosed Patients with Juvenile Idiopathic Arthritis (ICON‐JIA) Study Group, Childhood Arthritis Prospective Study (CAPS) Group, Randomized Placebo Phase Study of Rilonacept in sJIA (RAPPORT) Investigators, Sparks‐Childhood Arthritis Response to Medication Study (CHARMS) Group, Biologically Based Outcome Predictors in JIA (BBOP) Group. Genetic architecture distinguishes systemic juvenile idiopathic arthritis from other forms of juvenile idiopathic arthritis: clinical and therapeutic implications. Ann Rheum Dis 2017;76(5):906–913. - PMC - PubMed
    1. Mellins ED, Macaubas C, Grom AA. Pathogenesis of systemic juvenile idiopathic arthritis: some answers, more questions. Nat Rev Rheumatol 2011;7(7):416–426. - PMC - PubMed
    1. Shimizu M, Inoue N, Mizuta M, et al. Characteristic elevation of soluble TNF receptor II: I ratio in macrophage activation syndrome with systemic juvenile idiopathic arthritis. Clin Exp Immunol 2018;191(3):349–355. - PMC - PubMed
    1. Pascual V, Allantaz F, Arce E, et al. Role of interleukin‐1 (IL‐1) in the pathogenesis of systemic onset juvenile idiopathic arthritis and clinical response to IL‐1 blockade. J Exp Med 2005;201(9):1479–1486. - PMC - PubMed

LinkOut - more resources