

Determinants of Cyanobacteria and Algae Diversity in Natural Freshwater Micro-Ecosystems
- PMID: 40728190
- PMCID: PMC12306149
- DOI: 10.1111/1462-2920.70157
Determinants of Cyanobacteria and Algae Diversity in Natural Freshwater Micro-Ecosystems
Abstract
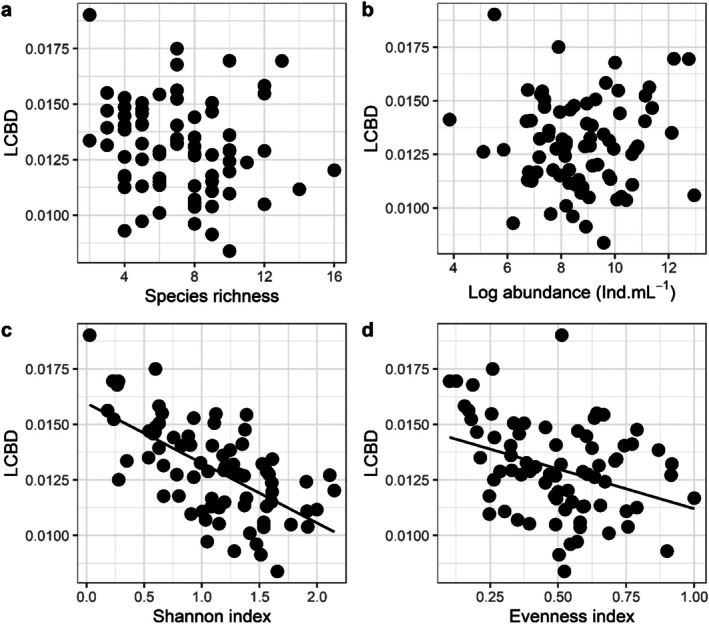
In this context, estimating the contributions of single sites to overall beta diversity (LCBD-Local Contribution to Beta Diversity, i.e., indicator of site's ecological uniqueness) or partitioning overall beta diversity into contributions of individual species (SCBD-Species Contribution to Beta Diversity, i.e., degree of variation of individual species across the study area) has proven to be a good approach to improve the knowledge of drivers of beta diversity. The number of studies on beta diversity in hyperdiverse environments, such as the Neotropics, is still scarce. We explored the contributions of each site and species to the overall cyanobacteria and algae beta diversity of 77 natural freshwater micro-ecosystems (i.e., tank bromeliads) of a neotropical ecosystem. We observed that LCBD was negatively related to Shannon diversity, turbidity and luminosity (% canopy cover). The negative relationship between LCBD and Shannon diversity indicates that micro ecosystems with less diversity reflect unique characteristics, and LCBD values can predict these environments. In our study, high LCBD values indicated environments in need of restoration, that is, poor in species richness and with greater turbidity and luminosity, showing that most bromeliad tanks presented high species diversity and low turbidity and luminosity.
Keywords: brightness; canopy cover; diversity patterns; phytotelma.
© 2025 The Author(s). Environmental Microbiology published by John Wiley & Sons Ltd.
Conflict of interest statement
The authors declare no conflicts of interest.
Figures


References
-
- Addicott, J. F. 1974. “Predation and Prey Community Structure: An Experimental Study of the Effect of Mosquito Larvae on the Protozoan Communities of Pitcher Plants.” Ecology 55: 475–492.
-
- Amundrud, S. L. , Srivastava D. S., and Lounibos L. P.. 2015. “Drought Sensitivity Predicts Habitat Size Sensitivity in an Aquatic Ecosystem.” Ecology 96: 1957–1965. - PubMed
-
- Anderson, M. J. , Crist T. O., Chase J. M., et al. 2011. “Navigating the Multiple Meanings of β Diversity: A Roadmap for the Practicing Ecologist.” Ecology Letters 14, no. 1: 19–28. - PubMed
-
- Antiqueira, P. A. P. , Petchey O. L., dos Santos V. P., de Oliveira V. M., and Romero G. Q.. 2018. “Environmental Change and Predator Diversity Drive Alpha and Beta Diversity in Freshwater Macro and Microorganisms.” Global Change Biology 24: 3715–3728. - PubMed
-
- Antiqueira, P. A. P. , Petchey O. L., Rezende F., Machado Velho L. F., Rodrigues L. C., and Romero G. Q.. 2022. “Warming and Top Predator Loss Drive Direct and Indirect Effects on Multiple Trophic Groups Within and Across Ecosystems.” Journal of Animal Ecology 91: 428–442. - PubMed
MeSH terms
Substances
Grants and funding
LinkOut - more resources
Full Text Sources
