. 2025 Sep;241(9):e70084.
doi: 10.1111/apha.70084.

Respiratory and Metabolic Effects of Active Expiration in Freely Behaving Rats

Affiliations

Respiratory and Metabolic Effects of Active Expiration in Freely Behaving Rats

Isabela P Leirão et al. Acta Physiol (Oxf). 2025 Sep.

Abstract

Aim: Exposure to low oxygen (hypoxia) or high carbon dioxide levels (hypercapnia) leads to a compensatory increase in pulmonary ventilation. Among the motor changes supporting the respiratory responses is the recruitment of abdominal expiratory muscles (ABD), which can enhance expiratory airflow or alter the duration of the expiratory phase. In this study, we assessed the impact of ABD recruitment on metabolic, motor, and ventilatory parameters in unanesthetized, freely behaving animals.

Methods: Sprague-Dawley Holtzman male adult rats (n = 7) were instrumented to perform simultaneous recordings of pulmonary ventilation, body temperature, diaphragmatic and ABD activities, and O2 consumption during exposure (20-30 min) to various levels of hypoxia (12%-8% O2) and hypercapnia (3%-7% CO2).

Results: Hypoxia or hypercapnia exposure evoked active expiration (AE); however, ABD recruitment did not occur during the entire exposure period, displaying an intermittent profile. The occurrence of AE during hypoxia and hypercapnia conditions was linked to additional increases in tidal volume when compared to periods without ABD activity (p < 0.05) and showed no associations with changes in diaphragmatic burst amplitude. Analyses of flow-like patterns suggested that AE during hypoxia recruited expiratory reserve volume during late expiration, while under hypercapnia, it accelerated lung emptying and increased the expiratory flow peak during post-inspiration. AE was also associated with increased oxygen consumption and did not improve air convection requirement.

Conclusion: AE enhances pulmonary ventilation during hypoxia and hypercapnia primarily by increasing tidal volume. However, this motor behavior may also affect other mechanical aspects of the respiratory system to improve alveolar ventilation and gas exchange.

Keywords: active expiration; breathing; hypercapnia; hypoxia; pulmonary ventilation.


Conflict of interest statement

The authors declare no conflicts of interest.

Figures

FIGURE 1
FIGURE 1
Pulmonary ventilation and EMG recordings in unanesthetized, freely behaving rats. (A) Schematic diagram and representative traces showing the experimental setup and recorded parameters. Pulmonary ventilation (upper black trace), inspiratory (blue trace) and expiratory (red trace) motor activities were measured in unanesthetized, freely behaving rats (see methods for details). Oxygen and carbon dioxide levels inside the chamber (lower black traces, respectively) were also monitored. (B) Examples of traces observed during the experiments. Only steady‐state periods during baseline, hypoxia, and hypercapnia. The transition periods from baseline to hypoxia or hypercapnia, as well as periods during which the animal moved, were excluded from the analysis. (C) Methods for data extraction and analyses. From respiratory‐related pressure signals (upper trace, black), tidal volume (VT) and respiratory frequency (fR) were determined and used to calculate minute ventilation (V˙ E). The 1st derivative of ventilation traces generated a flow‐like signal (second black trace), allowing the analysis of inspiratory (blue‐shaded area) and expiratory (red‐shaded area) patterns. The electromyograms of the diaphragm muscle (DIAEMG, blue traces) and of the oblique abdominal muscle (ABDEMG, red traces) show bursts occurring during inspiration and in the presence of active expiration, respectively.
FIGURE 2
FIGURE 2
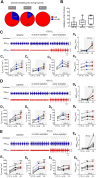
Functional characterization of active expiration during different hypoxia levels. (A) Pie graphs depicting the proportion of rats presenting (red) or not presenting (blue) active expiration during exposure to different levels of hypoxia (Left, 12% O2; middle, 10% O2; and right, 8% O2). (B) Boxplots (line represents the mean) showing the incidence of active expiration (% time the animal exhibited ABD muscle recruitment) during exposure to different levels of hypoxia (Left, 12% O2; middle, 10% O2; and right, 8% O2). (C–E) Representative traces of pulmonary ventilation (Ventilation, upper traces, black) and electromyograms of the diaphragm (DIAEMG, middle traces, blue) and oblique abdominal muscles (ABDEMG, lower traces, red) during baseline (21% O2) and hypoxia conditions (C, 12% O2; D, 10% O2; and E, 8% O2). Traces also show periods during hypoxia exposure without active expiration (i.e., absence of ABD rhythmic muscle activity) and with active expiration (i.e., rhythmic ABD muscle activity). C1–C5, D1–D5, and E1–E5. Graphs showing individual values of minute ventilation (V˙ E; C1, D1, and E1), tidal volume (VT; C2, D2 and E2), respiratory frequency (fR; C3, D3, and E3), DIAEMG (C4, D4, and E4), and ABDEMG (C5, D5, and E5) amplitudes, analyzed during baseline periods (baseline, white symbols) and hypoxia periods without (no AE, blue symbols) and with active expiration (AE, red symbols). C1–C5, 12% O2; D1–D5, 10% O2; and E1–E5, 8% O2. For all experiments n = 5–7. *p < 0.05 vs. 21% O2, **p < 0.01 vs. 21% O2, ***p < 0.001 vs. 21% O2, #p < 0.05 vs. no AE, ##p < 0.01 vs. no AE, ###p < 0.001 vs. no AE (repeated measures one‐way ANOVA).
FIGURE 3
FIGURE 3
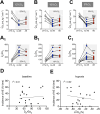
Correlation between active expiration and metabolic measurements during different hypoxia levels. (A–C) Graphs showing individual values of oxygen consumption (V˙O2) during baseline (baseline, white symbols) and hypoxia conditions without (no AE, blue symbols) and with active expiration (AE, red symbols). A, 12% O2; B, 10% O2; and C, 8% O2. A1, B1, and C1. Individual values of air convection requirement (V˙ E/V˙O2) during baseline (baseline, white symbols) and hypoxia conditions without (no AE, blue symbols) and with active expiration (AE, red symbols). A1, 12% O2; B1, 10% O2; and C1, 8% O2. (D) Correlation (linear regression) between the incidence of active expiration (% time the animal exhibited ABD muscle recruitment) and respiratory equivalent (V˙ E/V˙O2) during hypoxia. (E) Correlation (linear regression) between the incidence of active expiration (% time the animal exhibited ABD muscle recruitment) and changes in oxygen consumption (V˙O2) during hypoxia. For all experiments n = 5–7. *p < 0.05 vs. 21% O2, **p < 0.01 vs. 21% O2, ***p < 0.001 vs. 21% O2, #p < 0.05 vs. no AE, ##p < 0.01 vs. no AE, ###p < 0.001 vs. no AE (repeated measures one‐way ANOVA).
FIGURE 4
FIGURE 4
Functional characterization of active expiration during different hypercapnia levels. (A) Pie graphs depicting the proportion of rats presenting (red) or not presenting (blue) active expiration during exposure to different levels of hypercapnia (Left, 3% CO2; middle, 5% CO2; and right, 7% CO2). (B) Boxplots (line represents the median) showing the incidence of active expiration (% time the animal exhibited ABD muscle recruitment) during exposure to different levels of hypercapnia (Left, 3% CO2; middle, 5% CO2; and right, 7% CO2). (C–E) Representative traces of pulmonary ventilation (Ventilation, upper traces, black) and electromyograms of the diaphragm (DIAEMG, middle traces, blue) and oblique abdominal muscles (ABDEMG, lower traces, red) during baseline (0% CO2) and during hypercapnia (C, 3% CO2; D, 5% CO2; and E, 7% CO2). Traces also show periods without active expiration (i.e., absence of ABD rhythmic muscle activity) and with active expiration (i.e., rhythmic ABD muscle activity) during hypercapnia exposure. C1–C5, D1–D5, and E1–E5. Graphs showing individual values of minute ventilation (V˙ E; C1, D1, and E1), tidal volume (VT; C2, D2 and E2), respiratory frequency (fR; C3, D3, and E3), DIAEMG (C4, D4, and E4), and ABDEMG (C5, D5, and E5) amplitudes, analyzed during baseline (baseline, white symbols) and hypercapnia conditions without (no AE, blue symbols) and with active expiration (AE, red symbols). C1–C5, 3% CO2; D1–D5, 5% CO2; and E1–E5, 7% CO2. For all experiments n = 5–7. *p < 0.05 vs. 0% CO2, **p < 0.01 vs. 0% CO2, ***p < 0.001 vs. 0% CO2, #p < 0.05 vs. no AE, ##p < 0.01 vs. no AE (repeated measures one‐way ANOVA).
FIGURE 5
FIGURE 5
Correlation between active expiration and metabolic measurements during different hypercapnia levels. (A–C) Graphs showing individual values of oxygen consumption (V˙O2) during baseline (baseline, white symbols) and hypercapnia conditions without (no AE, blue symbols) and with active expiration (AE, red symbols). A, 3% CO2; B, 5% CO2; and C, 7% CO2. A1, B1, and C1. Individual values of respiratory equivalent (V˙ E/V˙O2) during baseline (baseline, white symbols) and hypercapnia conditions without (no AE, blue symbols) and with active expiration (AE, red symbols). A1, 3% CO2; B1, 5% CO2; and C1, 7% CO2. (D) Correlation (linear regression) between the incidence of active expiration (% time the animal exhibited ABD muscle recruitment) and air convection requirement (V˙ E/V˙O2) during hypercapnia. (E) Correlation (linear regression) between the incidence of active expiration (% time the animal exhibited ABD muscle recruitment) and changes in oxygen consumption (V˙O2) during hypercapnia. For all experiments n = 5–7. *p < 0.05 vs. 0% CO2, #p < 0.05 vs. no AE, ##p < 0.01 vs. no AE (repeated measures one‐way ANOVA).
FIGURE 6
FIGURE 6
Correlation between active expiration and sighs during hypoxia and hypercapnia. (A) Representative traces of pulmonary ventilation (Ventilation, upper traces, black) and electromyograms of the diaphragm (DIAEMG, middle traces, blue) and of the oblique abdominal muscles (ABDEMG, lower traces, red) during baseline (left) and hypoxia conditions (right). (B) Expanded traces of Ventilation, DIAEMG, and ABDEMG showing inspiratory and expiratory motor activity patterns during sighs during baseline (left) and hypoxia (right) conditions. (C) Occurrence of sighs (events/h) during baseline (21% O2) and different hypoxia levels (12%, 10%, and 8% O2). (D) Correlation (linear regression) between the incidence of active expiration (% time the animal exhibited ABD muscle recruitment) and sigh occurrence (events/h). (E) Representative traces of pulmonary ventilation (Ventilation, upper traces, black) and electromyograms of the diaphragm (DIAEMG, middle traces, blue) and of the oblique abdominal muscles (ABDEMG, lower traces, red) during baseline (left) and hypercapnia conditions (right). (F) Occurrence of sighs (events/h) during baseline (0% CO2) and different hypercapnia levels (3%, 5%, and 7% CO2). *p < 0.05 vs. 21% O2 (repeated measures one‐way ANOVA).
FIGURE 7
FIGURE 7
Active expiration and inspiratory/expiratory dynamics during hypoxia and hypercapnia. (A and C) Examples of ventilation traces (upper traces), superimposed traces of flow and diaphragm electromyogram (flow‐like signal and DIAEMG, middle traces), and abdominal electromyogram (ABDEMG, lower traces) during baseline (black) and during hypoxia (A) or hypercapnia (C) periods without (blue) and with active expiration (red). Vertical dotted lines indicate respiratory phases: I (inspiration), PI (post‐inspiration), E2 (expiratory stage 2). (B and D) Flow‐derived analyses of the inspiratory and expiratory patterns during baseline (black traces) and during hypoxia (B) or hypercapnia (D) periods without (blue traces) and with active expiration (red traces). Inspiratory (insp) and expiratory (exp) peaks are indicated by shaded areas in the flow‐like traces.
FIGURE 8
FIGURE 8
Respiratory phase durations and active expiration during hypoxia and hypercapnia. Average values of the duration of the inspiratory (I), post‐inspiratory (PI), and late expiratory (E2) phases in unanesthetized animals (n = 7) during hypoxia (panel A) or hypercapnia (panel B) exposure without (no AE) and with active expiration (AE). Values are expressed as a percentage of the total cycle duration. The top traces illustrate representative recordings of the diaphragm electromyogram (DIAEMG), which were used to define the respiratory phases (see the Methods section for more information). *Different from baseline conditions (normoxia/normocapnia); #Different from no AE conditions; p < 0.05 (repeated measures two‐way ANOVA).

Similar articles

References

    1. Del Negro C. A., Funk G. D., and Feldman J. L., “Breathing Matters,” Nature Reviews. Neuroscience 19, no. 6 (2018): 351–367. - PMC - PubMed
    1. Smith J. C., Ellenberger H. H., Ballanyi K., Richter D. W., and Feldman J. L., “Pre‐Botzinger Complex: A Brainstem Region That May Generate Respiratory Rhythm in Mammals,” Science 254, no. 5032 (1991): 726–729. - PMC - PubMed
    1. Tan W., Janczewski W. A., Yang P., Shao X. M., Callaway E. M., and Feldman J. L., “Silencing preBotzinger Complex Somatostatin‐Expressing Neurons Induces Persistent Apnea in Awake Rat,” Nature Neuroscience 11, no. 5 (2008): 538–540. - PMC - PubMed
    1. Richter D. W. and Smith J. C., “Respiratory Rhythm Generation In Vivo,” Physiology 29, no. 1 (2014): 58–71. - PMC - PubMed
    1. Dutschmann M., Jones S. E., Subramanian H. H., Stanic D., and Bautista T. G., “The Physiological Significance of Postinspiration in Respiratory Control,” Progress in Brain Research 212 (2014): 113–130. - PubMed

LinkOut - more resources