. 2025 Jul 25;17(7):1784-1809.
doi: 10.18632/aging.206288. Epub 2025 Jul 25.

Systemic factors in young human serum influence in vitro responses of human skin and bone marrow-derived blood cells in a microphysiological co-culture system

Affiliations

Systemic factors in young human serum influence in vitro responses of human skin and bone marrow-derived blood cells in a microphysiological co-culture system

Johanna Ritter et al. Aging (Albany NY). .

Abstract

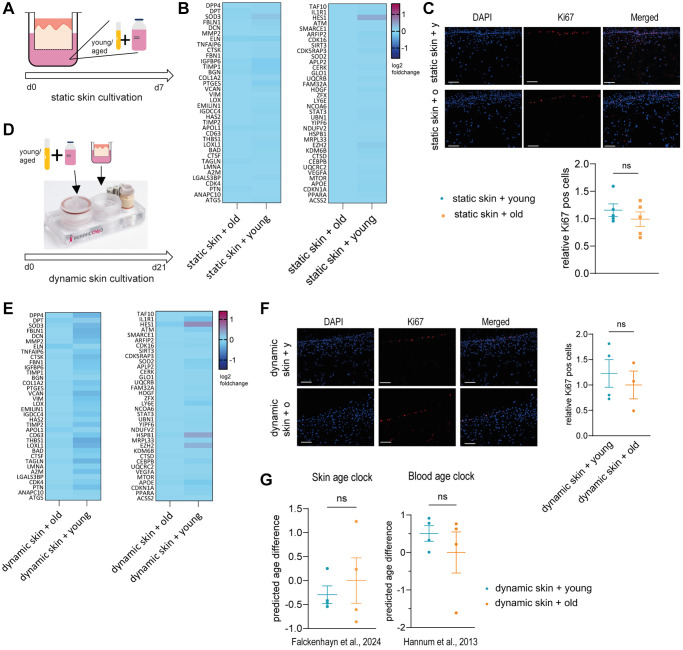
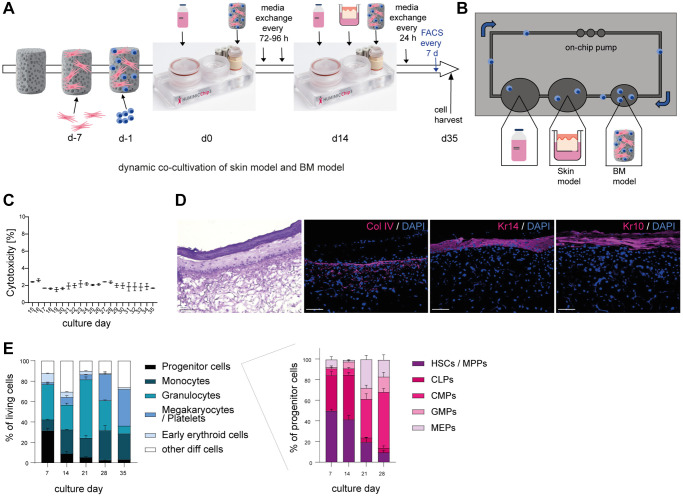
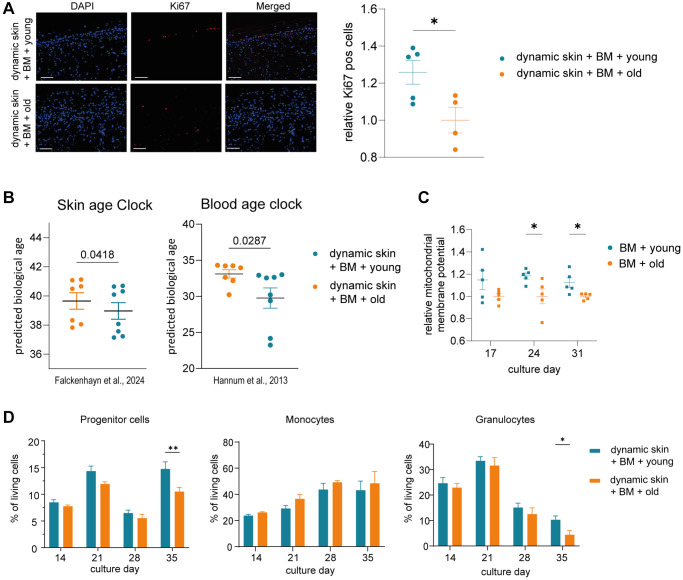
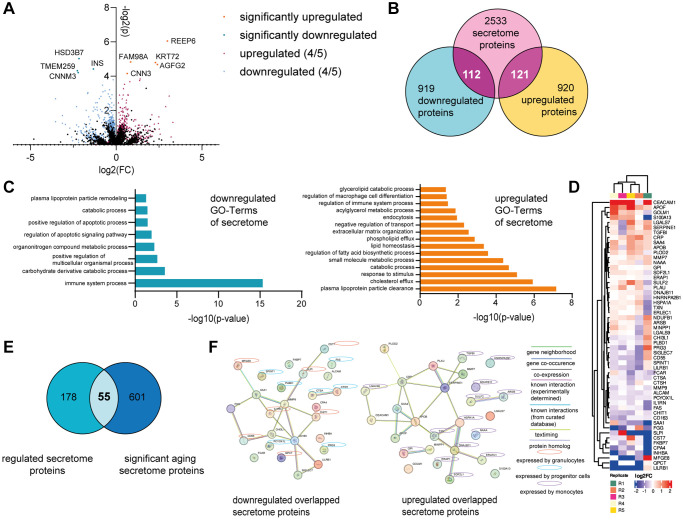
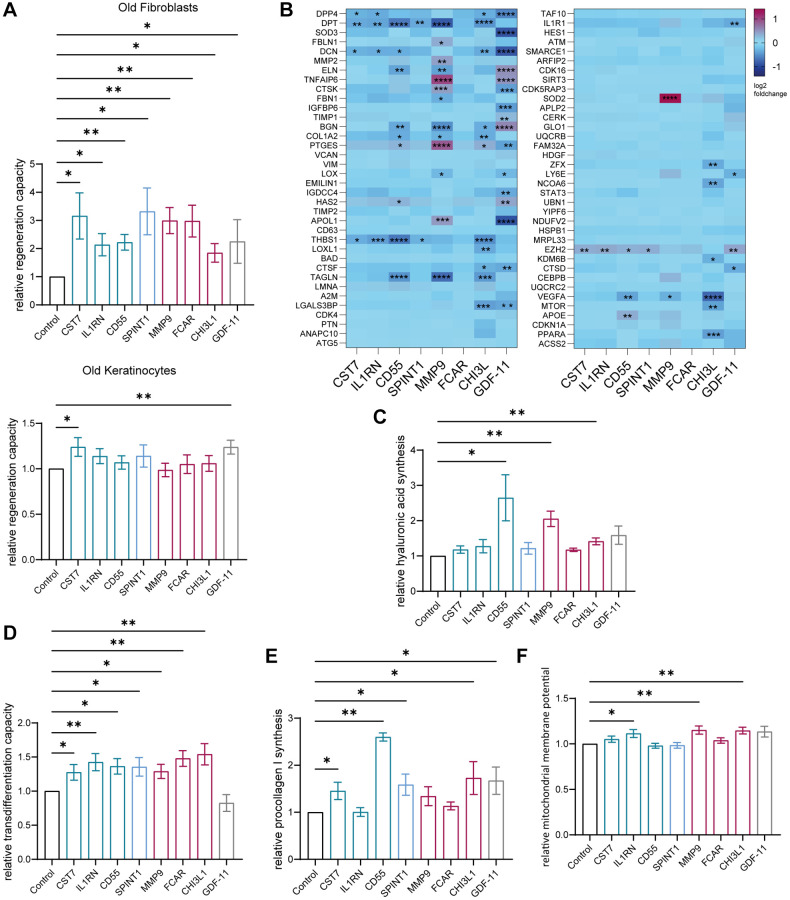
Aging is a complex process that significantly contributes to age-related diseases and poses significant challenges for effective interventions, with few holistic anti-aging approaches successfully reversing its signs. Heterochronic parabiosis studies illuminated the potential for rejuvenation through blood-borne factors, yet the specific drivers including underlying mechanisms remain largely unknown and until today insights have not been successfully translated to humans. In this study, we were able to recreate rejuvenation of the human skin via systemic factors using a microphysiological system including a 3D skin model and a 3D bone marrow model. Addition of young human serum in comparison to aged human serum resulted in an improvement of proliferation and a reduction of the biological age as measured by methylation-based age clocks in the skin tissue. Interestingly, this effect was only visible in the presence of bone marrow-derived cells. Further investigation of the bone marrow model revealed changes in the cell population in response to young versus aged human serum treatment. Using proteome analysis, we identified 55 potential systemic rejuvenating proteins produced by bone marrow-derived cells. For seven of these proteins, we were able to verify a rejuvenating effect on human skin cells using hallmarks of aging assays, supporting their role as systemic factors rejuvenating human skin tissue.

Keywords: bone marrow model; human serum; microphysiological systems; skin rejuvenation; systemic factors.


Conflict of interest statement

CONFLICTS OF INTEREST: The authors declare no conflicts of interest related to this study.

Figures

Figure 1
Figure 1
Young or old human serum alone does not have an effect on 3D skin models in static or dynamic culture. (AC) Human 3D skin models (Phenion®) were statically cultured with either young (<30 years) or old (>60 years) human serum as depicted in (A) for 7 days before analysis. (B) Heatmap indicating relative gene expression of skin models treated with old vs. young human serum, normalized to treatment with old serum. (C) Cryosections of treated skin models were analyzed by immunofluorescence staining of Ki67 (red). Representative images (scale bar = 100 μm) are shown in the upper panel. Bar graphs show the relative proportion of Ki67+ cells normalized to treatment with old serum. (DF) Human long life 3D skin models (Phenion®) were cultured dynamically using the HUMIMIC Chip3plus for 21 days in the presence of young or old human serum as depicted in (D). (E) Heatmap showing relative gene expression of dynamically cultured 3D skin models treated with old vs. young human serum, normalized to the control cultured with old serum. (F) Immunofluorescence staining of Ki67 (red) of dynamic 3D skin models comparing old to young human serum. Representative images (scale bar = 100 μm) are shown. Bar graphs show the relative proportion of Ki67+ cells normalized to treatment with old serum. (G) Determination of the DNA methylation-based biological age using the skin DNA methylation clock [7] and the blood age clock [8], normalized to treatment with old serum. Data are shown as mean values +/ SEM obtained from 1 experiment with 3–5 replicates, unpaired t-test, ns = p > 0.05, Author of HUMIMIC Chip3plus image in (D): TissUse GmbH, licensed under CC BY ND 4.0.
Figure 2
Figure 2
Successful co-cultivation of skin model and BM model in a long term dynamic in vitro MPS. Human BM-MSCs were pre-cultured on a hydroxyapatite coated zirconiumoxide based Sponceram® scaffold for 7 days, before adding human BM-CD34+ cells and transfer to the HUMIMIC Chip3plus. After two weeks, 3D long life skin models (Phenion®) were added to the Chip for another 3 weeks as depicted in (A). (B) Top view of the HUMIMIC Chip3plus illustrating the composition including skin model, BM model, media flow through the on-chip pump and recirculating BM-derived cells. (C) Measurement of LDH release in the supernatant of the co-culture. Cytotoxicity was determined as the percentage of released LDH normalized to the maximum LDH release of the skin models and BM cells after induced lysis. (D) Hematoxylin and eosin (left) and immunofluorescence (right) staining of Collagen IV (Col IV, red), Keratin 14 (Kr14, red) and Keratin 10 (Kr10, red) of the 3D skin model. Representative images, scale bar = 100 μm. (E) The proportions of different BM cell populations were determined using flow cytometry. Left, the percentage of all BM model populations (progenitor cells, monocytes, granulocytes, platelets/megakaryocytes, and early erythroids) among living cells is shown. Right, the percentage of progenitor cell populations such as hematopoietic stem cells (HSCs) and multipotent progenitors (MPPs), common lymphoid progenitors (CLPs), common myeloid progenitors (CMPs), granulocyte-monocyte progenitors (GMPs) and megakaryocyte-erythrocyte progenitors (MEPs) among all progenitor cells is depicted. Data are shown as mean values +/ SEM obtained from 1 experiment with 1–2 replicates. Author of HUMIMIC Chip3plus image in (A): TissUse GmbH, licensed under CC BY ND 4.0.
Figure 3
Figure 3
The skin model and the BM model show rejuvenated properties when co-cultured with young human serum in a long term dynamic in vitro MPS. The BM model was precultured in the HUMIMIC Chip3plus. After two weeks (culture day 14), the 3D long life skin model (Phenion) was added to the system and the co-culture treated with either young or old human serum for three weeks (culture day 14–35). (A) Immunofluorescence staining of Ki67 (red) of the 3D skin model. Representative images (scale bar = 100 μm) are shown on the left. Bar graphs show the relative proportion of Ki67+ cells normalized to treatment with old serum. (B) Determination of the DNA methylation-based biological age of the 3D skin models using the skin DNA methylation clock [7] and the blood age clock [8]. (C) Mitochondrial membrane potential of BM cells harvested on culture day 17, 24 and 31 normalized to treatment with old serum. (D) Flow cytometric analysis of BM cells. Bar graphs indicate the proportion of progenitor cells (left), monocytes (middle) and granulocytes (right) of all live BM cells after 14, 21, 28 and 35 days of culture. Data were obtained from one (A, C) or two (B, D) experiments with 4–7 replicates, shown as mean values +/ SEM (A, C, D) or mean values +/ SD (B). Unpaired t-test (A, B) or two-way ANOVA with Bonferroni correction (C, D), *p < 0.05, **p < 0.01.
Figure 4
Figure 4
The BM model secretes age-associated proteins. The BM model was statically cultured for five weeks. After two weeks, the BM cells were treated with either young or old human serum. On culture day 35, the BM cells were harvested, and the washed cell pellet analyzed using tandem LC-IMS-MS/MS proteomics. (A) Log2FC and −log2(p-value) of all significantly (p < 0.05) up (orange) or downregulated (turquoise) proteins in the BM with old serum compared to young serum. Proteins regulated in the same direction in at least 4 of 5 samples are depicted as well as either upregulated (red) or downregulated (blue). (B) Comparison of all regulated proteins to 2772 potentially secreted proteins according to the human protein atlas, creating an overlap of 233 proteins. (C) Go-Term analysis of down- (left) and up- (right) regulated overlapped proteins shown in (B). (D) Heatmap showing the log2FC of the overlapped 55 proteins in (E) depicting upregulated (red) and downregulated (blue) proteins with old serum. (E) Venn diagram showing the overlap of regulated proteins that belong to the human secretome (left) and secreted proteins that significantly change upon aging (right), resulting in 55 proteins shared between the two categories. (F) STRING protein network of the down- (left) and up- (right) regulated proteins from the 55 overlap proteins shown in (E). Expression by different BM cell types is highlighted with yellow circles (granulocytes), blue circles (progenitor cells) or violet circles (monocytes). Data were obtained from one experiment with 5 replicates.
Figure 5
Figure 5
Age-associated proteins secreted by the young BM model rejuvenate skin cells. Old (>60 years) human primary dermal fibroblasts and old (>60 years) human primary epidermal keratinocytes were statically cultured and treated with 100 ng/ml of the appropriate downregulated age-associated protein for 72 hours. (A) Immunofluorescence staining of Ki67 of fibroblasts (top) and keratinocytes (bottom). Bar graphs show the relative proportion of Ki67+ cells normalized to the corresponding untreated control, n = 5–20. (B) Heatmap indicating relative gene expression of statically cultured fibroblasts treated with proteins normalized to the untreated control, n = 4. (C) Bar graph illustrating the relative production of hyaluronic acid normalized to the untreated control, measured in the supernatant of fibroblasts, n = 3–7. (D) Bar graph showing the relative ability of fibroblasts to differentiate into adipocyte-like cells of fibroblasts treated with proteins normalized to the control cultured without proteins, n = 7–14. (E) Bar graph showing the relative production of procollagen 1 normalized to the untreated control, measured in the supernatant of fibroblasts, n = 3–7. (F). Bar graph illustrating the relative mitochondrial membrane potential of treated fibroblasts normalized to the corresponding untreated control, n = 6–10. Data are shown as mean values +/− SEM. Paired t-test, *p < 0.05, **p < 0.01, ***p < 0.001, ****p < 0.0001.

Similar articles

References

    1. Zouboulis CC, Makrantonaki E. Clinical and laboratory skin biomarkers of organ-specific diseases. Mech Ageing Dev. 2019; 177:144–9. 10.1016/j.mad.2018.08.003 - DOI - PubMed
    1. Pálovics R, Keller A, Schaum N, Tan W, Fehlmann T, Borja M, Kern F, Bonanno L, Calcuttawala K, Webber J, McGeever A, Luo J, Pisco AO, et al. , and Tabula Muris Consortium. Molecular hallmarks of heterochronic parabiosis at single-cell resolution. Nature. 2022; 603:309–14. 10.1038/s41586-022-04461-2 - DOI - PMC - PubMed
    1. Horvath S, Singh K, Raj K, Khairnar SI, Sanghavi A, Shrivastava A, Zoller JA, Li CZ, Herenu CB, Canatelli-Mallat M, Lehmann M, Habazin S, Novokmet M, et al. Reversal of biological age in multiple rat organs by young porcine plasma fraction. Geroscience. 2024; 46:367–94. 10.1007/s11357-023-00980-6 - DOI - PMC - PubMed
    1. Ma S, Wang S, Ye Y, Ren J, Chen R, Li W, Li J, Zhao L, Zhao Q, Sun G, Jing Y, Zuo Y, Xiong M, et al. Heterochronic parabiosis induces stem cell revitalization and systemic rejuvenation across aged tissues. Cell Stem Cell. 2022; 29:990–1005.e10. 10.1016/j.stem.2022.04.017 - DOI - PubMed
    1. Prattichizzo F, Frigé C, Pellegrini V, Scisciola L, Santoro A, Monti D, Rippo MR, Ivanchenko M, Olivieri F, Franceschi C. Organ-specific biological clocks: Ageotyping for personalized anti-aging medicine. Ageing Res Rev. 2024; 96:102253. 10.1016/j.arr.2024.102253 - DOI - PubMed

LinkOut - more resources