. 2025 Jul 29;50(4):252.
doi: 10.1007/s11064-025-04499-4.

Candesartan Mitigates Perioperative Neurocognitive Disorders by Modulating Hypertension-Linked Neuroinflammatory Factor

Affiliations

Candesartan Mitigates Perioperative Neurocognitive Disorders by Modulating Hypertension-Linked Neuroinflammatory Factor

Zhenyu Wu et al. Neurochem Res. .

Abstract

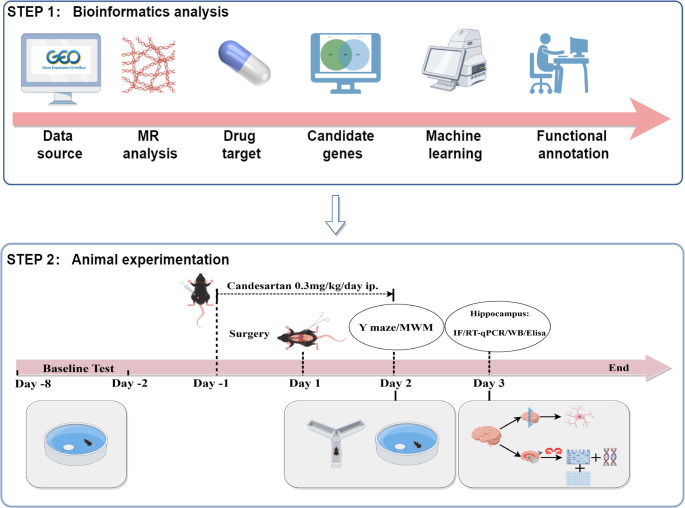
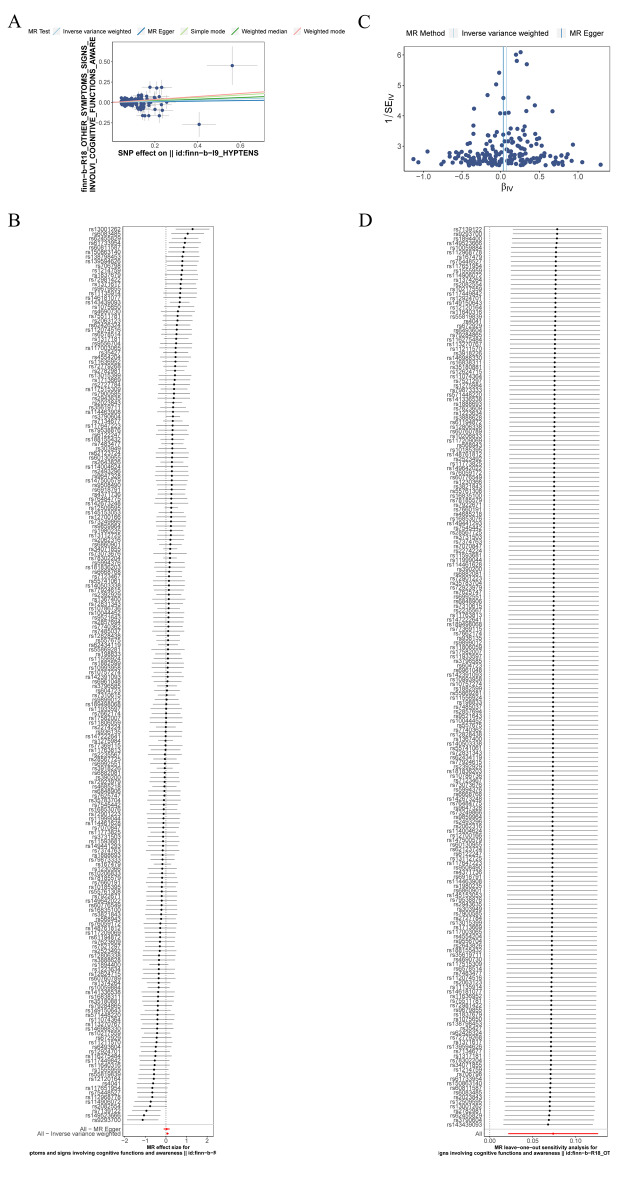
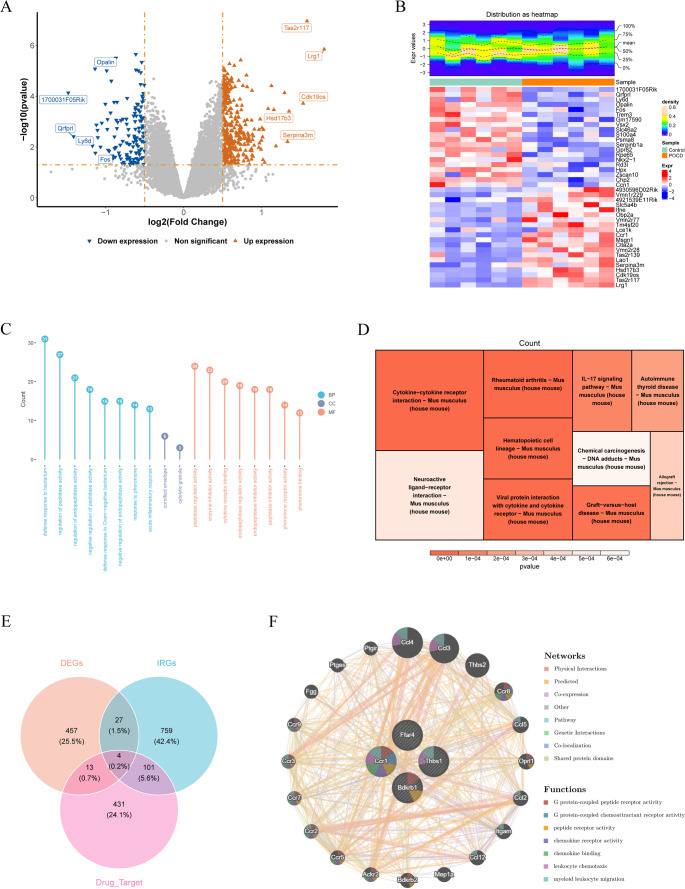
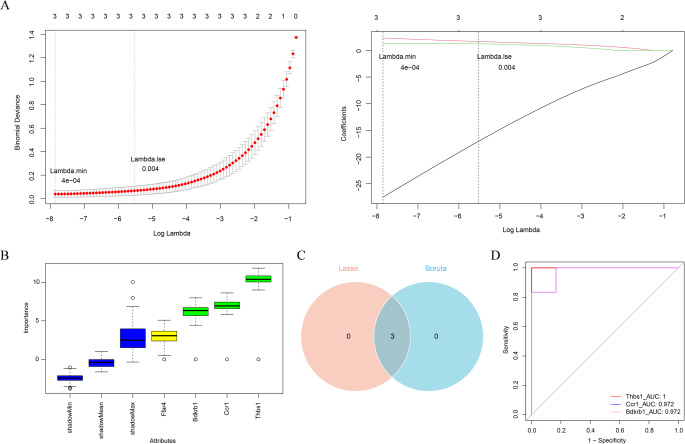
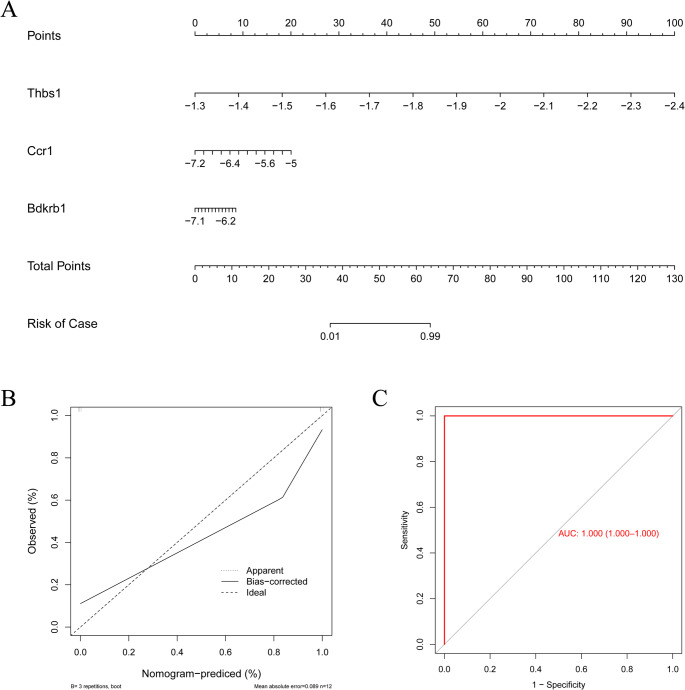
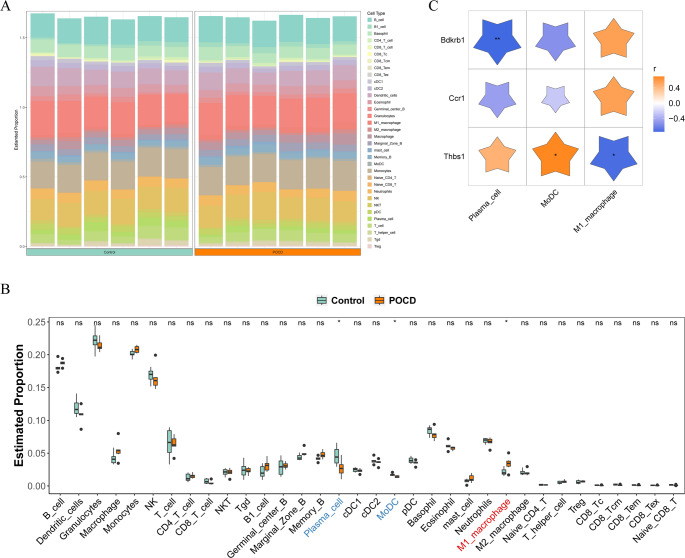
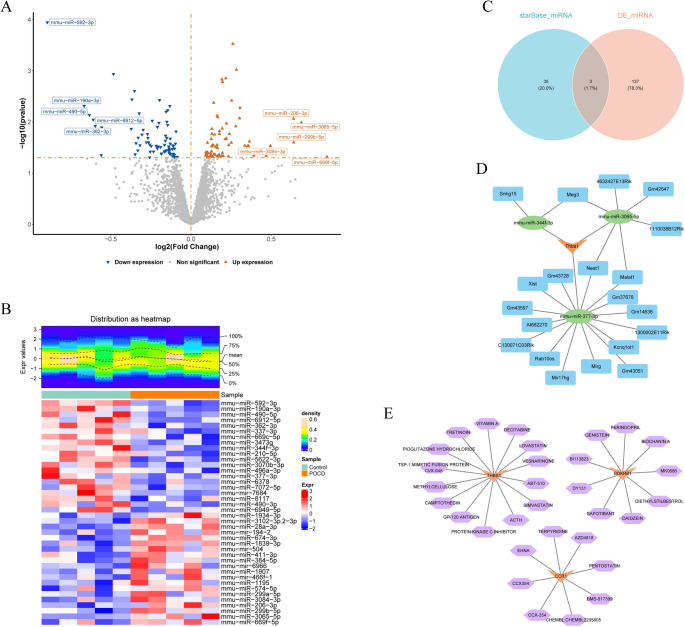
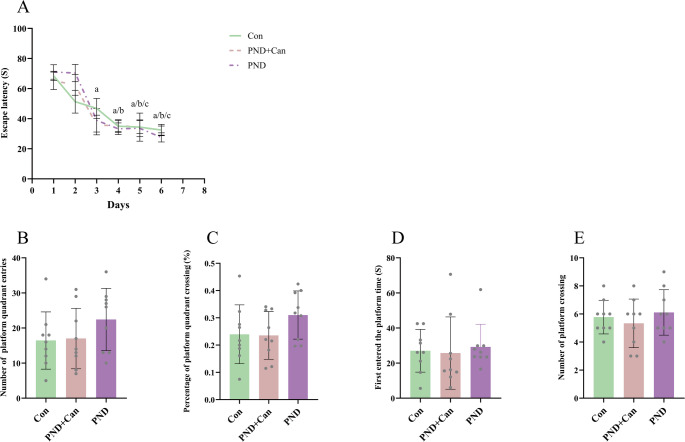
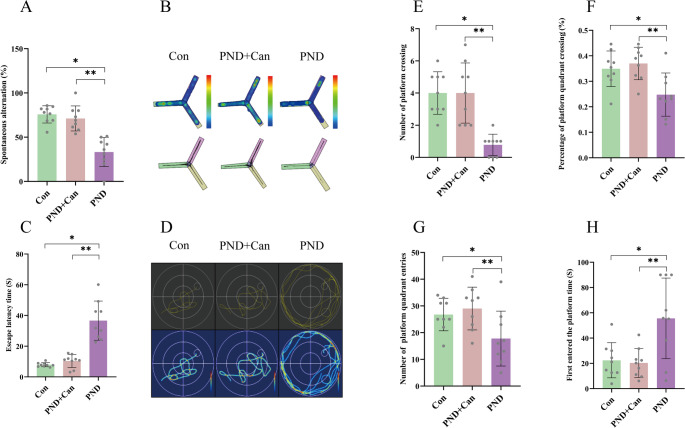
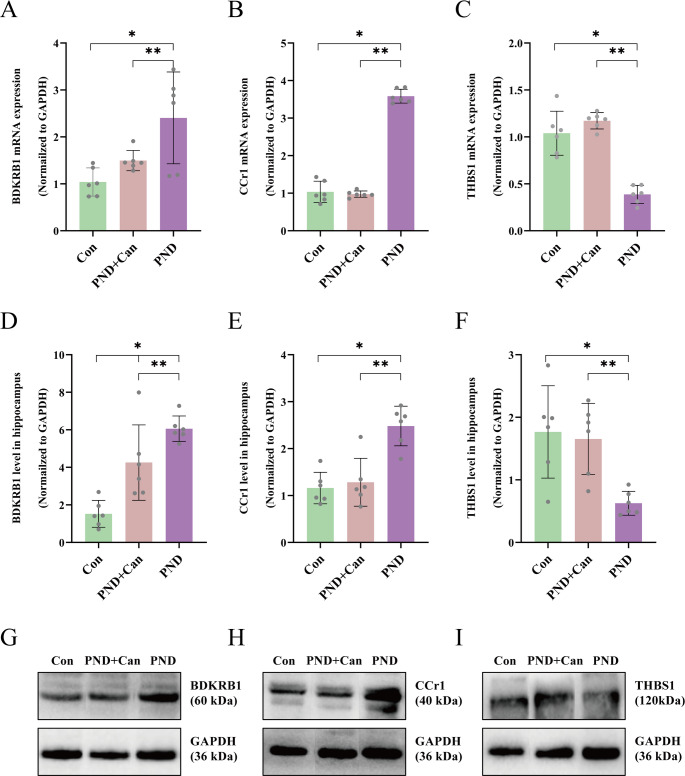
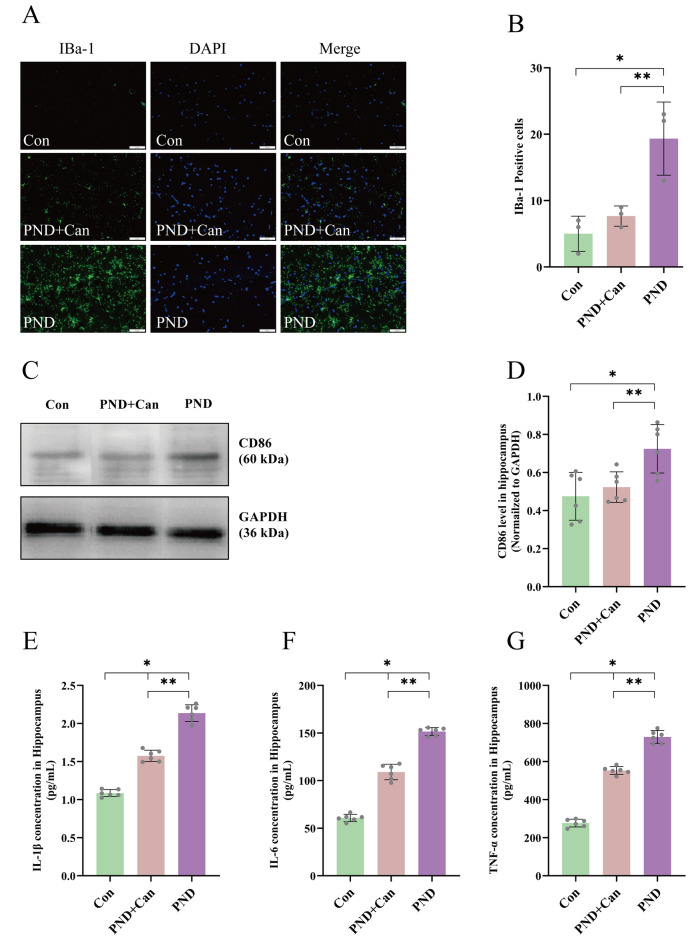
Perioperative neurocognitive disorders (PND) are linked to neuroinflammation, a key factor in hypertension, but their causal relationship is underexplored. This study aims to investigate whether hypertension is a risk factor for PND, identify related neuroinflammatory targets, and determine if the angiotensin receptor blockers (ARBs) candesartan can improve cognitive function in PND mouse models by modulating these targets. This study identified hypertension as a risk factor for cognitive dysfunction (OR = 1.0767, P = 0.0057) through Mendelian randomization (MR) analysis. Subsequently, bioinformatics techniques were employed to identify the neuroinflammatory targets associated with hypertension for ARBs. Differential analysis revealed Bdkrb1, Ccr1, and Thbs1 were PND biomarkers associated with hypertension, confirmed by machine learning and receiver operating characteristic (ROC) analysis (area under the curve (AUC) > 0.9). Immune infiltration showed Thbs1 positively correlated with MoDC cells (r = 0.70), while Bdkrb1 negatively correlated with Plasma cells (r = -0.75). In the PND mouse model, we assessed whether candesartan could inhibit the onset of neuroinflammation by modulating the targets identified through our screening process. Molecular experiments, including RT-qPCR, Western blotting, immunofluorescence, and ELISA, analyzed gene expression and neuroinflammatory changes in the hippocampus. In a PND mouse model, candesartan improved cognitive function, reducing escape latency and increasing spontaneous alternation rates. Molecular analysis demonstrated candesartan downregulated Bdkrb1 and Ccr1 expression while upregulating Thbs1 in the hippocampus. Additionally, candesartan reduced IL-1β, IL-6, TNF-α levels and microglial activation, highlighting its anti-inflammatory and neuroprotective effects in PND. In conclusion, candesartan improved cognitive function in PND mice by modulating Bdkrb1, Ccr1, and Thbs1, reducing neuroinflammation, and targeting hippocampal immune responses, highlighting its therapeutic potential for PND.

Keywords: Candesartan; Hypertension; Inflammation; Mendelian randomization; Perioperative neurocognitive disorders.


Conflict of interest statement

Declarations. Ethics Approval: The present study was approved by the Laboratory Animal Welfare and Ethics Committee of the Affiliated Hospital of Zunyi Medical University, with the number: zyfy-an-2024-0570. Competing Interests: The authors declare no competing interests.

Figures

Fig. 1
Fig. 1
The flow chart of this study(Drawing on Figdraw.com). The process described in Step 1 was derived through bioinformatics analysis, while the section in Step 2 pertains to the mouse experimentation component
Fig. 2
Fig. 2
Forward MR analysis of cognitive function and hypertension. (A) The scatter plot of cognitive function and hypertension. (B) The forest plot of cognitive function and hypertension. (C) The funnel plot of cognitive function and hypertension. (D) Forest plots of cognitive function and hypertension for leave-one-out tests
Fig. 3
Fig. 3
Identification and analysis of candidate genes. Volcano plot (A) and heatmap (B) of DEGs. The GO (C) and KEGG (D) enrichment of DEGs. (E) Venn plot for DEGs, IRGs, and drug target genes. (F) The network plot of GGI
Fig. 4
Fig. 4
Identification of biomarkers. (A) Lasso regression analysis for candidate genes. (B) Boruta analysis for candidate genes. (C) Venn plot of Lasso and Boruta. (D) The ROC analysis of biomarkers
Fig. 5
Fig. 5
Construction of nomogram. (A) Nomogram of biomarkers. (B) Calibration curve. (C) ROC curve for nomogram
Fig. 6
Fig. 6
Immune infiltration analysis. (A) Immune cell score stacking bar graph. (B) Boxplots of Immune cell scores in POCD and control Groups. (C) Heatmap of biomarkers correlation with differential immune cells
Fig. 7
Fig. 7
Analysis of potential mechanisms of biomarkers. Volcano plot (A) and heatmap (B) of differentially expressed miRNAs. (C) Venn plot of differentially expressed miRNAs and predicted miRNA. (D) The ceRNA network of biomarkers. (E) Biomarkers-drug network
Fig. 8
Fig. 8
Comparison of behavioral assessment before surgical and anesthesia. On the 4th, 5th, and 6th days, the escape latency of each mouse group reached a stable phase (A). In the spatial exploration experiment, no significant differences were observed, indicating that the cognitive abilities of all mice were at the same baseline level (B-E). (A) MWM positioning navigation experiment (escape latency). (B-E) MWM space exploration experiment: (B) number of platform quadrant entries.(C) percentage of platform quadrant crossing (%). (D) First entered platform time(S). (E) number of platform crossing. (Data are expressed as mean ± SD; aP < 0.05:significantly different from Comparison with the first day; bP < 0.05:significantly different from Comparison with the second day; cP < 0.05:significantly different from Comparison with the third day; n = 27.)
Fig. 9
Fig. 9
Comparison of behavioral assessment after surgical and anesthesia. The Y-maze (A-B) and Morris water maze (C-H) assays indicated that the learning and memory abilities of mice in the PND group were significantly impaired. Conversely, those of mice in the candesartan treatment group were notably improved. (A)Y-maze spontaneous alternation rate, (B) The locomotor trajectory of the mice within the maze; (C) MWM(working Memory Test)escape latency. (D) The locomotor trajectory of the mice within the maze; (E-H) MWM space exploration experiment: (E) number of platform quadrant entries. (F) percentage of platform quadrant crossing (%). (G) First entered platform time(S). (H) Number of platform crossing. (Data are expressed as mean ± SD; *P < 0.05: significantly different from Comparison with the Con group; **P < 0.05: significantly different from Comparison with the PND + Can group; n = 9.)
Fig. 10
Fig. 10
Expression of Bdkrb1, Ccr1, Thbs1 in each groups. Molecular biology experiments showed that candesartan reversed the upregulation of Bdkrb1 and Ccr1 mRNA and proteins and the downregulation of Thbs1 mRNA and proteins in the hippocampal tissue of postoperative mice. (A-C) Real-time PCR analysis of Bdkrb1, Ccr1, Thbs1 in the hippocampus. (D-F) Expression of Bdkrb1, Ccr1, Thbs1 proteins in each groups. (G-I) The protein expression bands of Bdkrb1, Ccr1, and Thbs1 in each group were observed. (Data are expressed as mean ± SD; *P < 0.05: significantly different from Comparison with the Con group; **P < 0.05: significantly different from Comparison with the PND + Can group; n = 6.)
Fig. 11
Fig. 11
The expression of microglia and inflammatory factors in each group of hippocampus. Candesartan inhibited the activation of M1 microglia in the hippocampus of postoperative mice (A-D) and significantly downregulated the release of inflammatory factors (E-G). (A-B) The expression of microglia in each group of hippocampus and the statistical chart. (Data are expressed as mean ± SD; *P < 0.05: significantly different from Comparison with the Con group; **P < 0.05: significantly different from Comparison with the PND + Can group; n = 3). (C-D)The CD86 protein expression bands and statistical charts in the hippocampal region of each group. (Data are expressed as mean ± SD; *P < 0.05: significantly different from Comparison with the Con group; **P < 0.05: significantly different from Comparison with the PND + Can group; n = 6). (E-G) The expressions of IL-1β, IL-6 and TNF-α in each group. (Data are expressed as mean ± SD; *P < 0.05: significantly different from Comparison with the Con group; **P < 0.05: significantly different from Comparison with the PND + Can group; n = 6)

Similar articles

References

    1. Needham MJ, Webb CE, Bryden DC (2017) Postoperative cognitive dysfunction and dementia: what we need to know and do. Br J Anaesth 119:i115–i125. 10.1093/bja/aex354 - PubMed
    1. Tasson L, Zingone F, Barberio B et al (2021) Sarcopenia, severe anxiety and increased C-reactive protein are associated with severe fatigue in patients with inflammatory bowel diseases. Sci Rep 11:15251. 10.1038/s41598-021-94685-5 - PMC - PubMed
    1. Qiu LL, Pan W, Luo D et al (2020) Dysregulation of bdnf/trkb signaling mediated by NMDAR/Ca(2+)/calpain might contribute to postoperative cognitive dysfunction in aging mice. J Neuroinflammation 17:23. 10.1186/s12974-019-1695-x - PMC - PubMed
    1. Yang X, Huang X, Li M et al (2022) Identification of individuals at risk for postoperative cognitive dysfunction (POCD). Ther Adv Neurol Disord 15:17562864221114356. 10.1177/17562864221114356 - PMC - PubMed
    1. Feinkohl I, Winterer G, Pischon T (2017) Hypertension and risk of Post-Operative cognitive dysfunction (POCD): A systematic review and Meta-Analysis. Clin Pract Epidemiol Ment Health 13:27–42. 10.2174/1745017901713010027 - PMC - PubMed

MeSH terms

LinkOut - more resources