Observational Study
. 2025 Sep;51(9):1573-1586.
doi: 10.1007/s00134-025-08047-0. Epub 2025 Jul 29.

Identification of transcriptomic sepsis endotypes in sub-Saharan Africa: derivation, validation, and global alignment in two Ugandan cohorts

Affiliations
Observational Study

Identification of transcriptomic sepsis endotypes in sub-Saharan Africa: derivation, validation, and global alignment in two Ugandan cohorts

Matthew J Cummings et al. Intensive Care Med. 2025 Sep.

Abstract

Purpose: Sub-Saharan Africa carries the highest global burden of critical illness, yet transcriptomic sepsis endotypes have not been defined in the region. Their clinical relevance and alignment with endotypes identified in high-income countries (HICs) remain unknown.

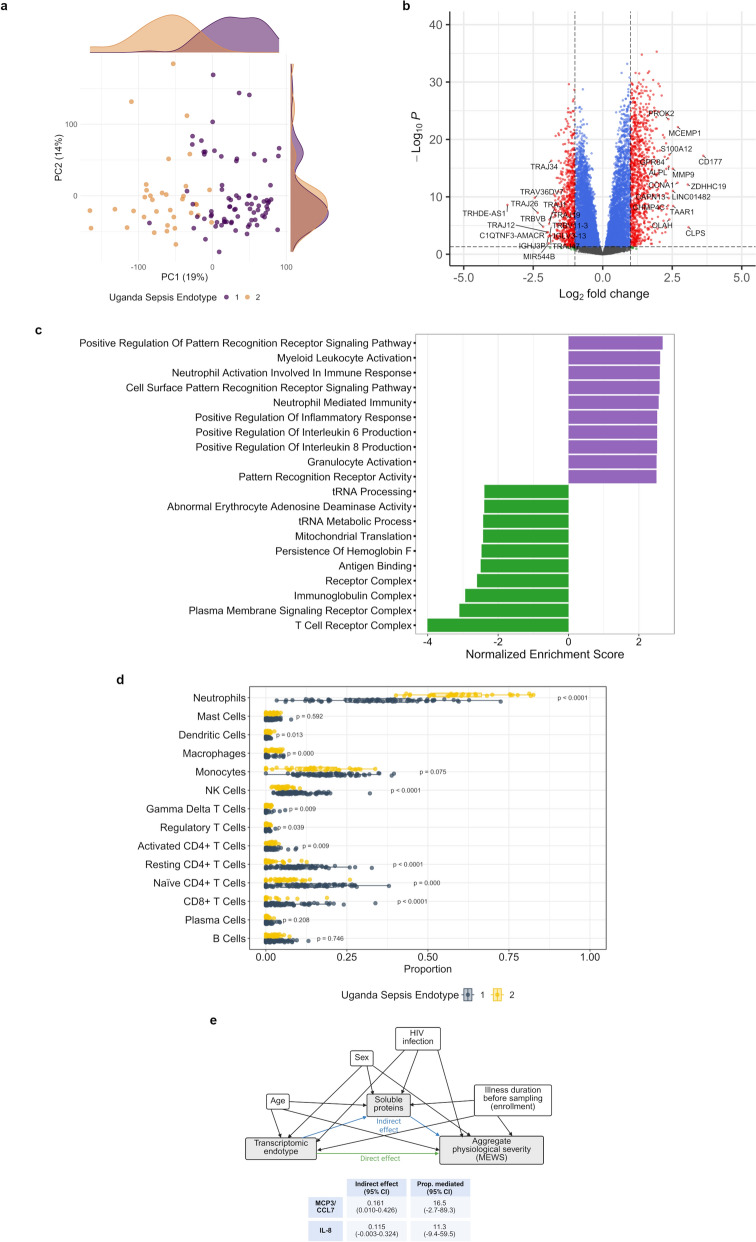
Methods: We analyzed data from two prospective observational cohorts of critically ill adults with sepsis in Uganda (discovery cohort [Tororo, rural], N = 243; validation cohort [Entebbe, urban], N = 112). Unsupervised clustering of whole-blood RNAseq data was used to identify endotypes in the discovery cohort. A random forest classifier was used to predict endotype assignment in the validation cohort. Differential gene expression, pathway enrichment, and digital cytometry were used to define endotype pathobiology and determine overlap with HIC-derived endotypes.

Results: Two endotypes-Uganda Sepsis Endotypes 1 (USE-1) and 2 (USE-2)-were identified in the discovery cohort. USE-2, marked by neutrophil-driven innate immune activation and lymphocyte suppression, was associated with greater physiological severity and higher mortality (41.3% vs. 22.0%; absolute difference 19.3%, 95% CI 7.6-30.9%), irrespective of HIV, tuberculosis, or malaria infection. A 13-gene classifier (misclassification rate 1.43%) replicated two endotypes in the validation cohort with similar biological and clinical profiles. USE-2 showed strong transcriptional overlap with SRS1 and inflammopathic endotypes but only modest concordance in patient-level assignments. Overlap with Mars1 was variable.

Conclusions: We identified two transcriptomic sepsis endotypes in Uganda that reflect inter-individual differences in targetable pathobiology and confer prognostic enrichment across high-burden infections. Divergence from HIC-derived endotypes highlights the need for sepsis classifications that are both globally relevant and locally responsive.

Keywords: Africa; HIV; High-throughput nucleotide sequencing; Precision medicine; Sepsis.


Conflict of interest statement

Declarations. Conflicts of interest: MJC reports consulting fees from Vertex Pharmaceuticals and Veracyte unrelated to the submitted work. The remaining authors declare no conflicts of interest. Ethical approval: Each enrolled participant or their surrogate provided written informed consent. Study protocols were approved by ethics committees at Columbia University (AAAR1450), Uganda Virus Research Institute (GC/127/17/02–06/582), and Uganda National Council for Science and Technology (HS2308). AI declaration: ChatGPT Education-4o (OpenAI) was used for grammatical correction and to enhance manuscript readability.

Figures

Fig. 1
Fig. 1
Transcriptomic endotypes in RESERVE-U-2-TOR discovery cohort (N = 243). a Dendrogram of hierarchical cluster partition; shading indicates hierarchical cluster partition prior to k-means consolidation. b First two principal components of transcriptomic variance; dots represent individual patients stratified by cluster (endotype) assignment. Density histograms show patient distribution stratified by endotype. c Volcano plot of differential gene expression in patients assigned to endotype 2 vs. 1. Red shading indicates genes differentially expressed at log2-fold change ≥|1| and Benjamini–Hochberg (BH)-adjusted p value ≤ 0.05. Blue shading indicates genes differentially expressed at log2-fold change <|1| and BH-adjusted p value ≤ 0.05. Grey shading indicates genes without significantly different expression (BH-adjusted p value > 0.05). The top 30 genes with increased or decreased expression by endotype are labeled. d Differential enrichment of key biological pathways in patients assigned to endotype 2 vs. 1 at BH-adjusted p value ≤ 0.05. e Immune cell population proportions by endotype as inferred from digital cytometry deconvolution. P values reflect results of Wilcoxon rank-sum test with BH adjustment. f Hypothesized causal pathway in which the direct (green arrow) and indirect (blue arrows, via soluble proteins) effects of endotype on physiological instability were estimated after adjustment for covariables that may potentially confound the exposure–mediator and mediator–outcome relationship. Proportion mediated represents the proportion of total effect that occurs through each protein mediator
Fig. 2
Fig. 2
Transcriptomic endotypes in RESERVE-U-1-EBB validation cohort (N = 112). a First two principal components of transcriptomic variance; dots represent individual patients stratified by endotype assignment as per 13-gene random forest classifier model. Density histograms show patient distribution stratified by endotype. b Volcano plot of differential gene expression in patients assigned to endotype 2 vs. 1. Red shading indicates genes differentially expressed at log2-fold change ≥|1| and Benjamini–Hochberg (BH)-adjusted p value ≤ 0.05. Blue shading indicates genes differentially expressed at log2-fold change <|1| and BH-adjusted p value ≤ 0.05. Grey shading indicates genes without significantly different expression (BH-adjusted p value > 0.05). Top 30 genes with increased or decreased expression by endotype are labeled. c Differential enrichment of key biological pathways in patients assigned to endotype 2 vs. 1 at BH-adjusted p value ≤ 0.05. d Immune cell population proportions by endotype as inferred from digital cytometry deconvolution. P values reflect results of Wilcoxon rank-sum test with BH adjustment. e Hypothesized causal pathway in which the direct (green arrow) and indirect (blue arrows, via soluble proteins) effects of endotype on physiological instability were estimated after adjustment for covariables that may potentially confound the exposure–mediator and mediator–outcome relationship. Proportion mediated represents the proportion of total effect that occurs through each protein mediator
Fig. 3
Fig. 3
Alignment between Uganda-derived endotypes and those identified in HICs in RESERVE-U-2-TOR discovery cohort (N = 243). a Biological comparison of high-risk Uganda Sepsis Endotype-2 (USE-2) and Sepsis Response Signature 1 (SRS1; assignment via 19-gene classifier). The x-axes represent log2 fold-change values for the comparison of patients assigned to USE-2 vs. USE-1. The y-axes represent log2 fold-change values for the comparison of patients assigned to SRS1 vs. SRS2/3. Colored and grey shading indicates genes differentially expressed with Benjamini–Hochberg p values ≤ 0.05 and > 0.05, respectively. b Alluvial plot illustrating the distribution of patient assignments between Uganda sepsis endotypes (USE-1, USE-2) and Sepsis response signatures (SRS1, SRS2, SRS3; assignments via 19-gene classifier). The width of each flow ribbon between the two classifications is proportional to the number of patients transitioning between each group. c Biological comparison of high-risk Uganda Sepsis Endotype-2 (USE-2) and Inflammopathic endotype. The x-axes represent log2 fold-change values for the comparison of patients assigned to USE-2 vs. USE-1. The y-axes represent log2 fold-change values for the comparison of patients assigned to Inflammopathic vs. Adaptive endotypes. Colored and grey shading indicates genes differentially expressed with Benjamini–Hochberg p values ≤ 0.05 and > 0.05, respectively. d Alluvial plot illustrating the distribution of patient assignments between Uganda Sepsis Endotypes (USE-1, USE-2) and Inflammopathic vs. Adaptive endotypes. The width of each flow ribbon between the two classifications is proportional to the number of patients transitioning between each group. e Biological comparison of high-risk Uganda Sepsis Endotype-2 (USE-2) and Mars1 endotype (assigned via classifier threshold of 1.15). The x-axes represent log2 fold-change values for the comparison of patients assigned to USE-2 vs. USE-1. The y-axes represent log2 fold-change values for the comparison of patients assigned to Mars1 vs. Mars2-4 endotypes. Colored and grey shading indicates genes differentially expressed with Benjamini–Hochberg p values ≤ 0.05 and > 0.05, respectively. f Alluvial plot illustrating the distribution of patient assignments between Uganda Sepsis Endotypes (USE-1, USE-2) and Mars1 (assigned via classifier threshold of 1.15) vs. Mars2-4 endotypes. The width of each flow ribbon between the two classifications is proportional to the number of patients transitioning between each group
Fig. 4
Fig. 4
Alignment between Uganda-derived endotypes and those identified in HICs in RESERVE-U-1-EBB validation cohort (N = 112). a Biological comparison of high-risk Uganda Sepsis Endotype-2 (USE-2) and Sepsis Response Signature 1 (SRS1; assignment via 19-gene classifier). The x-axes represent log2 fold-change values for the comparison of patients assigned to USE-2 vs. USE-1. The y-axes represent log2 fold-change values for the comparison of patients assigned to SRS1 vs. SRS2/3. Colored and grey shading indicates genes differentially expressed with Benjamini–Hochberg p values ≤ 0.05 and > 0.05, respectively. b Alluvial plot illustrating the distribution of patient assignments between Uganda sepsis endotypes (USE-1, USE-2) and Sepsis response signatures (SRS1, SRS2, SRS3; assignments via 19-gene classifier). The width of each flow ribbon between the two classifications is proportional to the number of patients transitioning between each group. c Biological comparison of high-risk Uganda Sepsis Endotype-2 (USE-2) and Inflammopathic endotype. The x-axes represent log2 fold-change values for the comparison of patients assigned to USE-2 vs. USE-1. The y-axes represent log2 fold-change values for the comparison of patients assigned to Inflammopathic vs. Adaptive endotypes. Colored and grey shading indicates genes differentially expressed with Benjamini–Hochberg p values ≤ 0.05 and > 0.05, respectively. d Alluvial plot illustrating the distribution of patient assignments between Uganda Sepsis Endotypes (USE-1, USE-2) and Inflammopathic vs. Adaptive endotypes. The width of each flow ribbon between the two classifications is proportional to the number of patients transitioning between each group. e Biological comparison of high-risk Uganda Sepsis Endotype-2 (USE-2) and Mars1 endotype (assigned via classifier threshold of 0.84). The x-axes represent log2 fold-change values for the comparison of patients assigned to USE-2 vs. USE-1. The y-axes represent log2 fold-change values for the comparison of patients assigned to Mars1 vs. Mars2-4 endotypes. Colored and grey shading indicates genes differentially expressed with Benjamini–Hochberg p values ≤ 0.05 and > 0.05, respectively. f Alluvial plot illustrating the distribution of patient assignments between Uganda sepsis endotypes (USE-1, USE-2) and Mars1 (assigned via classifier threshold of 0.84) vs. Mars2-4 endotypes. The width of each flow ribbon between the two classifications is proportional to the number of patients transitioning between each group

References

    1. Rudd KE, Johnson SC, Agesa KM, Shackelford KA, Tsoi D, Kievlan DR et al (2020) Global, regional, and national sepsis incidence and mortality, 1990–2017: analysis for the Global Burden of Disease Study. Lancet 395:200–211 - PMC - PubMed
    1. Lewis JM, Feasey NA, Rylance J (2019) Aetiology and outcomes of sepsis in adults in sub-Saharan Africa: a systematic review and meta-analysis. Crit Care 23:212 - PMC - PubMed
    1. Rhee C, Jones TM, Hamad Y, Pande A, Varon J, O’Brien C et al (2019) Prevalence, Underlying Causes, and Preventability of Sepsis-Associated Mortality in US Acute Care Hospitals. JAMA Netw Open 2:e187571 - PMC - PubMed
    1. Vincent JL, Sakr Y, Singer M, Martin-Loeches I, Machado FR, Marshall JC et al (2020) Prevalence and Outcomes of Infection Among Patients in Intensive Care Units in 2017. JAMA 323:1478–1487 - PMC - PubMed
    1. Davenport EE, Burnham KL, Radhakrishnan J, Humburg P, Hutton P, Mills TC et al (2016) Genomic landscape of the individual host response and outcomes in sepsis: a prospective cohort study. Lancet Respir Med 4:259–271 - PMC - PubMed

Publication types

LinkOut - more resources