. 2025 Jul 29;150(1):10.
doi: 10.1007/s00401-025-02913-3.

Single-cell transcriptomic landscape of the neuroimmune compartment in amyotrophic lateral sclerosis brain and spinal cord

Affiliations

Single-cell transcriptomic landscape of the neuroimmune compartment in amyotrophic lateral sclerosis brain and spinal cord

John F Tuddenham et al. Acta Neuropathol. .

Abstract

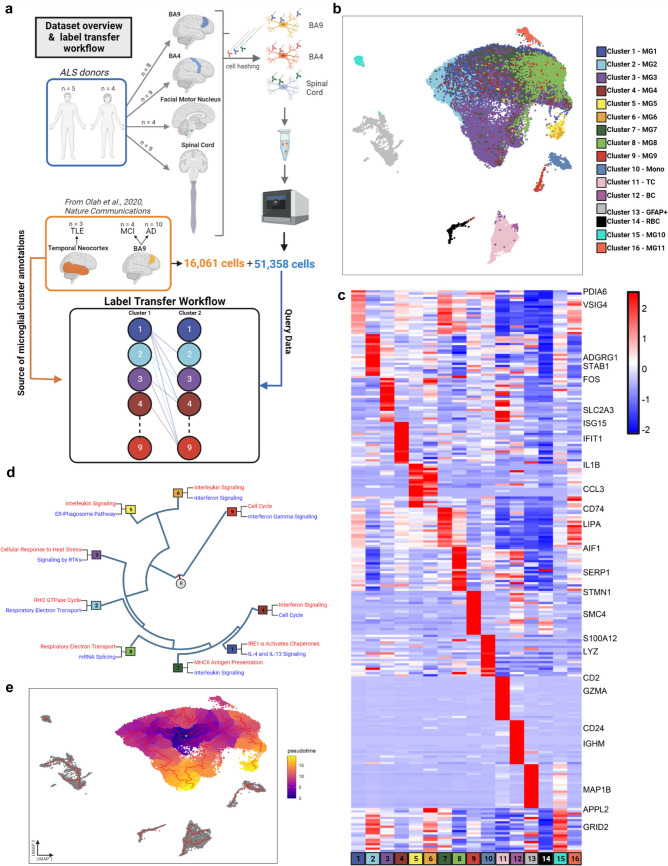
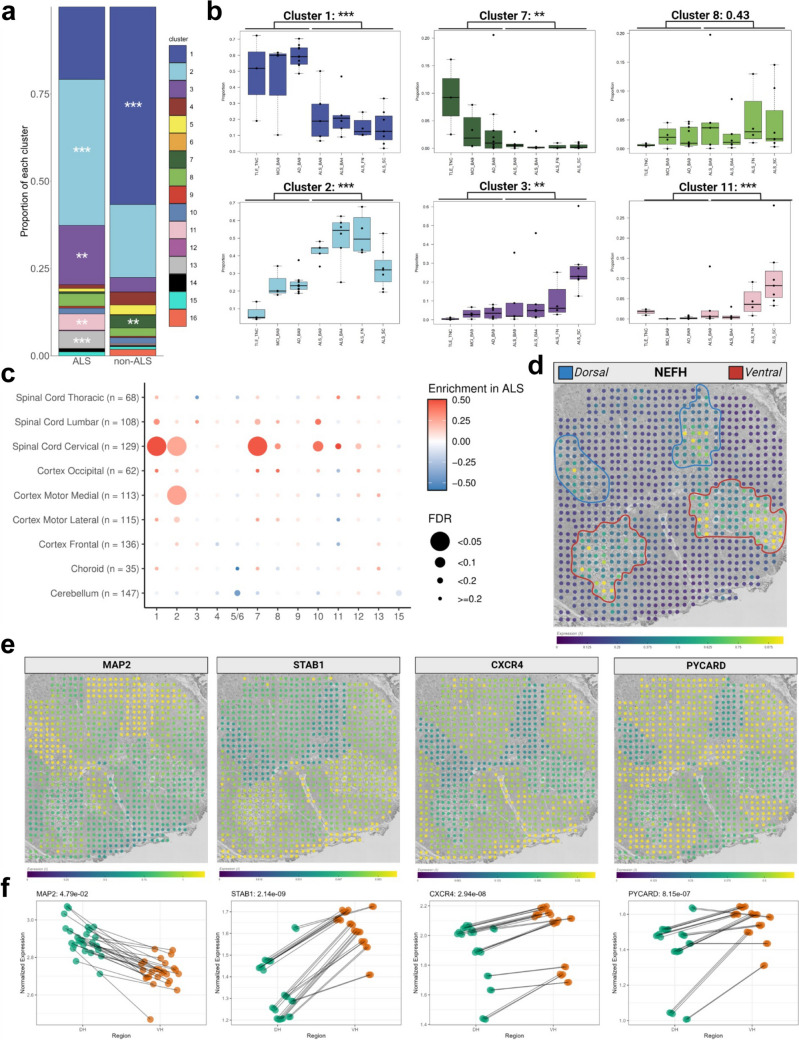
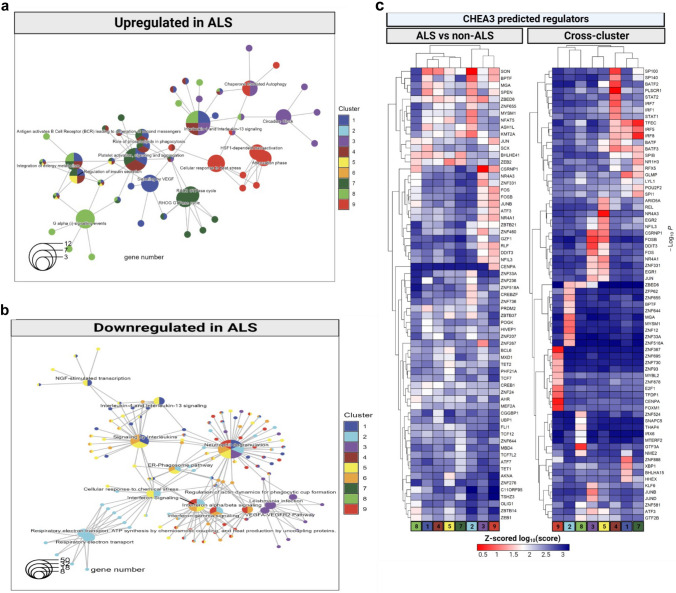
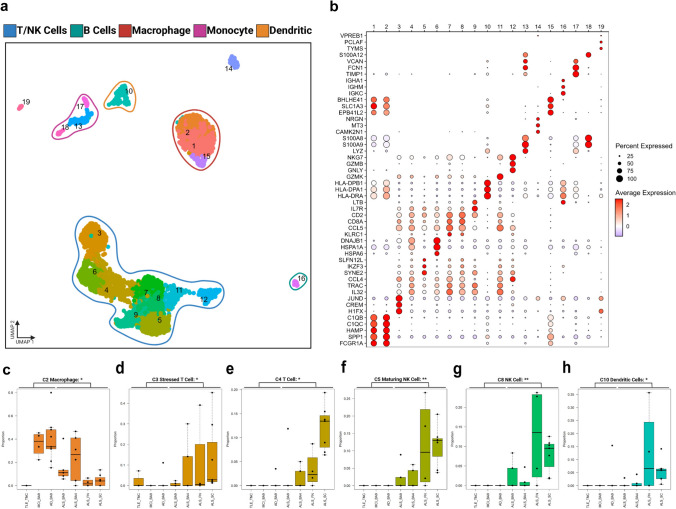
Development of therapeutic approaches that target specific microglia responses in amyotrophic lateral sclerosis (ALS) is crucial due to the involvement of microglia in ALS progression. Our study identifies the predominant microglia subset in human ALS primary motor cortex and spinal cord as an undifferentiated phenotype with dysregulated respiratory electron transport. Moreover, we find that the interferon response microglia subset is enriched in donors with aggressive disease progression, while a previously described potentially protective microglia phenotype is depleted in ALS. Additionally, we observe an enrichment of non-microglial immune cell, mainly NK/T cells, in the ALS central nervous system, primarily in the spinal cord. These findings pave the way for the development of microglia subset-specific therapeutic interventions to slow or even stop ALS progression.

Keywords: Amyotrophic lateral sclerosis; Microglia; Phenotypic heterogeneity; Single-cell RNA-sequencing.


Conflict of interest statement

Declarations. Conflict of interest: The authors declare no competing interests.

Figures

Fig. 1
Fig. 1
The population structure of microglia in human ALS brain and spinal cord. We used label transfer to explore the microglia (and other immune cell) phenotypes present in the central nervous system (CNS) of ALS donors. a Sample collection and label transfer workflow. Multiple CNS regions were sampled from 9 ALS donors with similar representation of both sexes. Single cell RNA sequencing data of live CD45 + immune cells was generated using the 10 × Chromium platform. The ALS data was mapped onto our previously published microglia population structure by utilizing a pairwise machine learning approach with random forest classifiers and consensus voting to identify final labels. b UMAP projection of the merged dataset. The merged dataset is plotted on the first two UMAP components following Harmony batch correction. Each dot is a single cell. Microglia cluster 15 (MG10) had no unique gene set, while cluster 16 (MG11) was present only in one donor, accordingly they were not included in downstream analysis. c ALS microglia subsets have unique marker gene sets. Heatmap representing Z-scored expression data. Each column is a single cluster and each row is a single gene. d Microglial subsets present in ALS have distinctive functional annotations. Hierarchical dendogram demonstrating the functional landscape of microglia subsets. Similarity of subsets was calculated using Euclidean distance across the average expression profiles of each cell subtype. R denotes the root node. Top up- and down-regulated terms were selected from Reactome pathway annotation to highlight unique aspects of each microglial subsets. Terms in red are upregulated in a given cluster while terms in blue are downregulated. e Microglia subsets in ALS reside along divergent state transition trajectories. A pseudotime trajectory was built with monocle3, setting the root point in the middle of cluster 1. The trajectory is highlighted in red, showing the shifts seen across different aspects of the microglial cloud, including different pseudotime endpoints. BA Brodmann area, ALS amyotrophic lateral sclerosis, UMAP uniform manifold approximation and projection, R root node
Fig. 2
Fig. 2
ALS induces robust, region specific shifts in microglial subtype prevalence. a Global changes in microglia subset relative abundance in ALS. Stacked bar chart showing the overall changes in immune cell relative abundance. Each bar shows the proportion of the different microglial and non-microglia immune cell subsets in each condition: non-ALS and ALS. Asterisks denote significant difference between conditions, using the Wilcoxon rank-sum test and BH correction to determine significance. *** < 0.005, ** < 0.01, * < 0.05. b Region-specific changes in microglia cluster relative abundance in ALS. Boxplots showing the distribution of individual cluster relative abundances across disease-region pairings. Representative clusters with significant, region-specific changes are shown. Boxplots denote the 25th percentile, median, and 75th percentile, with whiskers capturing 1.5 IQR in both directions. c Orthogonal validation in an independent bulk RNA-seq dataset confirms consistent association of microglia Cluster 2 signature with ALS. Using a separate bulk RNA-seq cohort of 170 samples from ALS patients and non-ALS neurological disease patients or control patients, signatures of the top 20 genes per cluster were used to delineate the enrichment of different cluster signatures in ALS versus non-ALS samples. Notably, cluster 2 is the only cluster that shows significant enrichment in ALS in multiple regions, while cluster 1 and 7 enrichment likely capture the increase in overall microglia numbers in ALS. d Orthogonal validation in an independent spatial transcriptomic dataset confirms the upregulation of ALS associated microglial subset marker genes at the anatomical sites of motor neuron death in ALS. Spatial transcriptomic data was repurposed from Maniatas et al. A representative image from the slide viewer at https://als-st.nygenome.org/ is shown, displaying the neuronal gene NEFH, which is primarily found in the dorsal and ventral horns. Color bar is expression lambda calculated by the Splotch model. Dorsal and Ventral horns are demarcated in blue and red respectively. Representative images in the following panels are from the same section. ef Marker genes of clusters 2 and 8 follow inverse patterns of upregulation in comparison to MAP2 in the dorsal and ventral horns of ALS patients. Representative images for each gene as in (d) are shown in (e). In f, dotplots compare the summed score of predicted counts for a given gene in all spots in the dorsal horn (green) to an identical score for that gene summed from all spots in the ventral horn (green) across a subset of donors with strong MAP2 detection. Testing for the significance of differences between regions for each gene was conducted with Welch’s t-test and the Holm-Bonferroni correction. STAB1 is a defining gene for cluster 2, CXCR4 is a marker for cluster 3, and PYCARD is a defining gene for cluster 8. Abbreviations: BA Brodmann area, ALS amyotrophic lateral sclerosis, AD Alzheimer’s disease, MCI mild cognitive impairment, TLE temporal lobe epilepsy, ALS amyotrophic lateral sclerosis, BA Brodmann area, TNC temporal neocortex, SC spinal cord, SN substantia nigra, FN facial nucleus, IQR interquartile range, FDR false discover rate, DH dorsal horn, VH ventral horn
Fig. 3
Fig. 3
ALS results in functional changes in microglia subsets. Annotating between subset and within-subset shifts in ALS microglia at the level of transcriptome, proteome, and epigenome. ab Annotation of ALS associated transcriptional changes within each microglia cluster reveals functional shifts in ALS microglia. REACTOME pathway analysis of differentially expressed genes within each microglia cluster between ALS and non-ALS. Results are displayed as a connectivity plot, where central nodes represent REACTOME pathways, while terminal nodes represent genes associated with those REACTOME terms. Central nodes are colored based on the enrichment of the term in a given cluster, while terminal nodes are colored based on the presence of the gene in the differentially expressed gene list for the ALS vs. non-ALS comparison for a cluster. Genes/terms upregulated in ALS are shown in (a) and genes/terms downregulated in ALS are shown in (b). Please note that many of the pathways are differentially expressed in more than one microglia cluster. c Identification of differential and shared transcriptional regulators in cross-cluster and within-cluster cross-disease comparisons. Both heatmaps show Z-scored log-normalized scores from CHEA3. On the left panel, genes used for regulator calculation were the top 50 genes derived from within-cluster across-disease differential expression for each cluster. On the right panel, genes used as input were selected top 20 marker genes per cluster. Rows and columns are clustered hierarchically by absolute linkage. Each row shows the scores for a single regulator across all microglia clusters (columns)
Fig. 4
Fig. 4
Independent clustering of non-microglial immune cells identifies shifts in myeloid and adaptive immune cell populations in ALS. a Independent clustering of non-microglial immune cells. Non-microglial immune cells were isolated in silico and separately processed. Optimized clustering resolution was chosen with ChooseR. Clusters with greater than 10 cells are plotted on the UMAP. b Selected marker genes identify diverse immune populations. Each column represents one of the clusters, and each row represents the z-scored expression of a given gene. The plot is colored according to the level of expression and the size of each circle represents the percentage of cells in each cluster that express the gene. ch Annotation identifies enrichment of T and NK cells in ALS, as well as enrichment of dendritic cells and depletion of macrophages. Boxplots denote the 25th percentile, median, and 75th percentile, with whiskers capturing 1.5 IQR in both directions. Asterisks denote the significance of the difference between conditions, using the Wilcoxon rank-sum test and BH correction to determine significance. * < 0.05. ALS amyotrophic lateral sclerosis, NK natural killer

Update of

Similar articles

References

    1. Ahmed RM, Devenney EM, Strikwerda-Brown C, Hodges JR, Piguet O, Kiernan MC (2020) Phenotypic variability in ALS-FTD and effect on survival. Neurology 94:e2005–e2013. 10.1212/WNL.0000000000009398 - PubMed
    1. Benjamini Y, Hochberg Y (1995) Controlling the false discovery rate: a practical and powerful approach to multiple testing. J Royal Statistical Soc 57(1):289–300
    1. Berdynski M, Miszta P, Safranow K, Andersen PM, Morita M, Filipek S et al (2022) SOD1 mutations associated with amyotrophic lateral sclerosis analysis of variant severity. Sci Rep 12:103. 10.1038/s41598-021-03891-8 - PMC - PubMed
    1. Blighe K, Rana S, Lewis M (2022) EnhancedVolcano: publication-ready volcano plots with enhanced colouring and labeling
    1. Brettschneider J, Libon DJ, Toledo JB, Xie SX, McCluskey L, Elman L et al (2012) Microglial activation and TDP-43 pathology correlate with executive dysfunction in amyotrophic lateral sclerosis. Acta Neuropathol 123:395–407. 10.1007/s00401-011-0932-x - PMC - PubMed

LinkOut - more resources