. 2025 Jul 29:13:RP90905.
doi: 10.7554/eLife.90905.

Altered reactivity to threatening stimuli in Drosophila models of Parkinson's disease, revealed by a trial-based assay

Affiliations

Altered reactivity to threatening stimuli in Drosophila models of Parkinson's disease, revealed by a trial-based assay

Márton Kajtor et al. Elife. .

Abstract

The fruit fly Drosophila melanogaster emerges as an affordable, genetically tractable model of behavior and brain diseases. However, despite the surprising level of evolutionary conservation from flies to humans, significant genetic, circuit-level, and behavioral differences hinder the interpretability of fruit fly models for human disease. Therefore, to allow a more direct fly-versus-human comparison, we surveyed the rarely exploited, rich behavioral repertoire of fruit flies with genetic alterations relevant to Parkinson's disease (PD), including overexpression of human mutant Parkin or α-synuclein proteins and mutations in dopamine receptors. Flies with different genetic backgrounds displayed variable behaviors, including freezing, slowing, and running, in response to predator-mimicking passing shadows used as threatening stimuli in a single-animal trial-based assay. We found that the expression of human mutant Parkin in flies resulted in reduced walking speed and decreased reactivity to passing shadows. Flies with dopamine receptor mutations showed similar alterations, consistent with the motor and cognitive deficits typical in humans with PD. We also found age-dependent trends in behavioral choice during the fly lifespan, while dopamine receptor mutant flies maintained their decreased general reactivity throughout all age groups. Our data demonstrate that single-trial behavioral analysis can reveal subtle behavioral changes in mutant flies that can be used to further our understanding of disease pathomechanisms and help gauge the validity of genetic Drosophila models of neurodegeneration, taking us one step closer to bridging the gap in fly-to-human translation.

Keywords: D. melanogaster; Parkin; Parkinson's disease; dopamine; escape; neuroscience; threat; α-synuclein.


Conflict of interest statement

MK, VB, BK, PK, TK, HS, KS, AV, EU, DB, SS, DK, TV, BH No competing interests declared

Figures

Figure 1.
Figure 1.. Behavioral apparatus and experimental design.
(a) Top left, schematic of the experimental setup. Top right, schematic of the fly arena. Bottom left, photograph of the experimental setup. Bottom right, a photograph of the fly arena. (b) Timeline of a session showing the shadow presentations in red over the yellow background.
Figure 1—figure supplement 1.
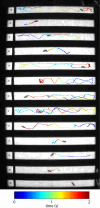
Figure 1—figure supplement 1.. Fly tracks from the camera view.
The 13 tunnels of the arena from the camera view with the tracking lines showing that the animals can move in 2 dimensions. The tracking line color indicates time, with dark blue and red marking the beginning and the end of the tracking, respectively.
Figure 2.
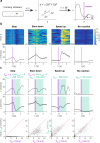
Figure 2.. Behavioral characterization of the escape behavior repertoire of individual fruit flies.
(a) Schematic for calculating speed and acceleration based on tracked position coordinates. (b) Four characteristic escape behaviors categorized by PCA for an example session of a control fly (w1118; from left; stop, slow down, speed up, no reaction). Top, color-coded heatmaps indicating the walking speed of the fly (blue, low speed; yellow, high speed), aligned to shadow presentations (purple line). Bottom, average moving speed triggered on the shadow presentations (purple line). Line and errorshade show mean ± SE. (c) Threshold-based classification of behavioral responses (from left, stop, slow down, speed up, no reaction). Top, single-trial example for each response type. Time intervals for calculating the average speed before the shadow presentation (purple) as well as the speed and acceleration after the shadow presentation (light green) are marked. Threshold values for each response type are displayed above the graphs. Middle, average walking speed across the trials from all sessions of w1118 flies, sorted by the type of behavioral response. Line and errorshade show mean ± SE. Bottom, scatter plots showing minimal (Stop and Slow down trials) or average (Speed up and No reaction trials) post-stimulus speed vs. average pre-stimulus speed, representing the same trials as above.
Figure 3.
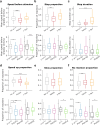
Figure 3.. PD transgenic and dopamine receptor mutant fruit flies showed reduced walking speed and decreased reactivity to threatening stimuli.
(a) Distribution of the mean speed measured in the time window [–0.2, 0] seconds relative to shadow presentation for the different mutant groups. Top, Parkin flies showed reduced mean speed compared to controls (Parkin vs. iso w1118; p=6.55 × 10⁻⁶, Mann–Whitney U-test). Bottom, Dop1R1 and DopEcR mutant flies showed reduced mean speed compared to controls (y1w67c23 and w1118, respectively; p=0.0016, p=0.0034; Mann-Whitney U-test). (b) Distribution of the proportion of stop trials in different mutant groups. Parkin flies showed a reduced tendency for stopping compared to iso w1118 (p=0.0043, Mann Whitney U test). (c) Distribution of stop duration in different mutant groups. α-Syn flies showed increased stop durations compared to iso w1118 (p=2.18 × 10⁻¹¹, Mann-Whitney U-test). (d) Distribution of the proportion of speed-up trials in different mutant groups. Top, α-Syn flies showed a reduced tendency to speed up compared to their controls (p=8.4 × 10⁻⁶, Mann-Whitney U-test). Bottom, Dop1R1 and Dop1R2 mutant flies also showed a significantly reduced tendency to speed up compared to their controls (p=0.0122 and p=0.0024, respectively; Mann-Whitney U-test). (e) Distribution of the proportion of slow down trials in different mutant groups. Bottom, DopEcR showed a 15.04% decrease compared to w1118 (p=0.020, Mann-Whitney U-test). (f) Distribution of the proportion of ‘no reaction’ trials in different mutant groups. Top, Parkin mutants showed reduced reactivity compared to iso w1118 controls (p=0.0043, Mann-Whitney U-test). Bottom, Dop1R1 and DopEcR mutants also showed reduced reactivity compared to y1w67c23 and w1118 controls, respectively (p=0.0173 and p=0.0167, respectively; Mann-Whitney U-test). Box-whisker plots show median, interquartile range, and non-outlier range. *, p<0.05; **, p<0.01; ***, p<0.001. Exact genotypes: iso w1118: +; +; Ddc-Gal4/+. Parkin: +; +; Ddc-Gal4/UAS-Parkin-R275W. α-Syn: +; +; Ddc-Gal4/UAS-α-Syn-A53T. y1 w67c23: y1 w67c23. Dop1R: y1 w*; Mi{MIC}Dop1R1MI04437. Dop1R2: y1 w*; Mi{MIC}Dop1R2MI08664. DopEcR: w1118; PBac{PB}DopEcRc02142/TM6B, Tb1.
Figure 3—figure supplement 1.
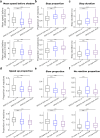
Figure 3—figure supplement 1.. Escape behavior of Parkin and α-Syn flies compared to mutants overexpressing GFP.
(a) Distribution of the mean speed measured in the 0.2 s before shadow presentation for Parkin, α-Syn, and +GFP mutant groups. Parkin and α-Syn flies showed reduced mean speed compared to +GFP controls (Parkin vs. +GFP, p=1.58 x 10⁻¹¹; α-Syn vs. +GFP, p=2.85 x 10⁻⁴; Mann-Whitney U-test). (b) Distribution of the proportion of stop trials in different mutant groups. Parkin flies showed a reduced tendency for stopping compared to the +GFP group (Parkin vs. +GFP, p=7.1 x 10⁻⁵; α-Syn vs. +GFP, p=0.67; Mann-Whitney U-test). (c) Distribution of stop duration in different mutant groups. α-Syn flies showed increased stop durations compared to GFP (Parkin vs. +GFP, p=0.17; α-Syn vs. +GFP, p=3.98 x 10⁻¹⁰; Mann-Whitney U-test). (d) Distribution of the proportion of speed-up trials in different mutant groups. Both Parkin and α-Syn flies showed a reduced tendency to speed up compared to +GFP controls (Parkin vs. +GFP, p=8.3 x 10⁻⁵; α-Syn vs. +GFP, p=1.96 x 10⁻¹²; Mann-Whitney U-test). (e) Distribution of the proportion of slow down trials in different mutant groups. Parkin flies showed a reduced tendency to slow down compared to +GFP controls (Parkin vs. +GFP, p=0.044; α-Syn vs. +GFP, p=0.465; Mann-Whitney U-test). (f) Distribution of the proportion of ‘no reaction’ trials in different mutant groups. Both Parkin and α-Syn flies showed reduced reactivity compared to +GFP controls (Parkin vs. +GFP, p=9.4 x 10⁻¹³; α-Syn vs. +GFP, P=1,3 x 10⁻⁸; Mann-Whitney U-test). *, p<0.05; **, p<0.01; ***, p<0.001. Exact genotypes: iso w1118: +; +; Ddc-Gal4/+. Parkin: +; +; Ddc-Gal4/UAS-Parkin-R275W. α-Syn: +; +; Ddc-Gal4/UAS-α-Syn-A53T.
Figure 3—figure supplement 2.
Figure 3—figure supplement 2.. Restricting Parkin and α-Syn mutations to dopaminergic neurons.
(a) Distribution of the mean speed measured in the 0.2 s before shadow presentation for Parkin (R275W), α-Syn (A53T) and control (iso w1118) groups. Top, NP6510-Gal4 lines; bottom, TH-Gal4 lines in all panels. NP6510-Gal4-R275W, 30.3% decrease compared to NP6510-Gal4-iso w1118, p=1.55 x 10⁻⁶; NP6510-Gal4-A53T, 20.4% decrease compared to NP6510-Gal4-iso w1118, p=5.82 x 10⁻¹⁰; TH-Gal4-R275W, 13.08% decrease compared to TH-Gal4-iso w1118, p=1.49 x 10⁻⁶; TH-Gal4-A53T, 17.57% decrease compared to TH-Gal4-iso w1118, p=6.75 x 10⁻⁷; Mann–Whitney U-test. (b) Distribution of the proportion of stop trials in different mutant groups. NP6510-Gal4-R275W, 16.47% increase compared to NP6510-Gal4-iso w1118, p=4.4 x 10⁻¹¹; NP6510-Gal4-A53T, 20.17% increase compared to NP6510-Gal4-iso w1118, p=1.38 x 10⁻¹⁷; TH-Gal4-R275W, 16.32% increase compared to TH-Gal4-iso w1118, p=1.55 x 10⁻⁴; TH-Gal4-A53T, 22.41% increase compared to TH-Gal4-iso w1118, p=8.82 x 10⁻¹⁰, Mann–Whitney U-test. (c) Distribution of stop duration in different mutant groups. NP6510-Gal4-R275W, 42.6% increase compared to NP6510-Gal4-iso w1118, p=5.99–5; NP6510-Gal4-A53T, 69.5% increase compared to NP6510-Gal4-iso w1118, p=4.33 x 10⁻¹¹; TH-Gal4-R275W, 33.62% increase compared to TH-Gal4-iso w1118, p=1.63 x 10⁻⁶; TH-Gal4-A53T, 37.48% increase compared to TH-Gal4-iso w1118, p=3.89 x 10⁻⁷; Mann–Whitney U-test. (d) Distribution of the proportion of speed up trials in different mutant groups. NP6510-Gal4-R275W, 9.1% decrease compared to NP6510-Gal4-iso w1118, p=0.0052; NP6510-Gal4-A53T, 9.1% decrease compared to NP6510-Gal4-iso w1118, p=3.14 x 10⁻⁴; TH-Gal4-R275W, 13.3% decrease compared to TH-Gal4-iso w1118, p=1.25 x 10⁻⁹; TH-Gal4-A53T, 20% decrease compared to TH-Gal4-iso w1118, p=1.33 x 10⁻¹⁵; Mann–Whitney U-test. (e) Distribution of the proportion of slow down trials in different mutant groups. NP6510-Gal4-R275W, 22.2% decrease compared to NP6510-Gal4-iso w1118, p=8.23–5; NP6510-Gal4-A53T, 39.1% decrease NP6510-Gal4-iso w1118, p=2.42 x 10⁻¹⁰; TH-Gal4-R275W, 22.8% decrease compared to TH-Gal4-iso w1118, p=2.85 x 10⁻⁸; TH-Gal4-A53T, 31.49% decrease compared to TH-Gal4-iso w1118, p=1.95 x 10⁻¹¹; Mann–Whitney U-test. (f) Distribution of the proportion of ‘no reaction’ trials in different mutant groups. NP6510-Gal4-R275W, 57.14% increase compared to NP6510-Gal4-iso w1118, p=3.49–8; NP6510-Gal4-A53T, 14.28% increase compared to NP6510-Gal4-iso w1118, p=0.1658; TH-Gal4-R275W, 66.7% increase compared to TH-Gal4-iso w1118, p=2.77 x 10⁻¹⁰; TH-Gal4-A53T, 66.7% increase compared to TH-Gal4-iso w1118, p=1.11 x 10⁻⁶; Mann–Whitney U-test.
Figure 3—figure supplement 3.
Figure 3—figure supplement 3.. Stop duration showed large variance in α-Syn flies.
(a) Distributions of stop duration in iso w1118 controls, Parkin, and α-Syn flies. (b) Permutation tests revealed a significantly increased variance in α-Syn compared to control flies (p=0.0001). Histograms show shuffled variance difference between Parkin (left) or α-Syn (right) and control groups. The observed difference in variance is indicated by a blue vertical line. The critical value corresponding to p=0.05 is indicated by a green dashed vertical line.
Figure 4.
Figure 4.. Reaction to threatening stimuli depends on fly walking speed.
(a) Probability of a given response type as a function of average fly speed before the shadow presentation (200ms pre-stimulus time window). From left, stop, slow down, speed up, and no reaction trials are quantified. Top, Parkin, and α-Syn flies. Bottom, Dop1R1, Dop1R2, and DopEcR mutant flies. (b) Proportion of a given response type as a function of average fly speed before the shadow presentation. Top, Parkin and α-Syn flies. Bottom, Dop1R1, Dop1R2, and DopEcR mutant flies. Exact genotypes: iso w1118: +; +; Ddc-Gal4/+. Parkin: +; +; Ddc-Gal4/UAS-Parkin-R275W. α-Syn: +; +; Ddc-Gal4/UAS-α-Syn-A53T. y1 w67c23: y1 w67c23. Dop1R: y1 w*; Mi{MIC}Dop1R1MI04437. Dop1R2: y1 w*; Mi{MIC}Dop1R2MI08664. DopEcR: w1118; PBac{PB}DopEcRc02142/TM6B, Tb1.
Figure 4—figure supplement 1.
Figure 4—figure supplement 1.. Differences in walking speed do not explain different escape behaviors.
Real and simulated proportion of response types are shown for the mutant groups tested. For the simulations, random velocity values were drawn from the velocity distribution of each genotype and then a response type was randomly selected based on the response type distributions associated with the drawn velocity. Bar plots show the proportion of response types color-coded. For each mutant group, the right bar shows the measured proportion of escape responses, while the left bar shows the simulated distribution. We found significant differences between the real and simulated distributions for the following groups: Parkin (p=0.0487), α-Syn (p<0.000001), Dop1R2 (p=0.006157), and DopEcR (p=0.003901). We found no significant differences for the Dop1R1 group (p=0.332; Chi-square test for all the statistics). *, p<0.05; **, p<0.01; ***, p<0.001. Exact genotypes: iso w1118: +; +; Ddc-Gal4/+. Parkin: +; +; Ddc-Gal4/UAS-Parkin-R275W. α-Syn: +; +; Ddc-Gal4/UAS-α-Syn-A53T. y1 w67c23: y1 w67c23. Dop1R: y1 w*; Mi{MIC}Dop1R1MI04437. Dop1R2: y1 w*; Mi{MIC}Dop1R2MI08664. DopEcR: w1118; PBac{PB}DopEcRc02142/TM6B, Tb1.
Figure 5.
Figure 5.. Changes in escape behavior from the first to the fourth week of life.
Proportion of responses as a function of age for different groups of mutants and controls. From left to right, stop, slow down, speed up, and no reaction trials are quantified. Lines and error shades show mean and standard error. Exact genotypes: iso w1118: +; +; Ddc-Gal4/+. Parkin: +; +; Ddc-Gal4/UAS-Parkin-R275W. α-Syn: +; +; Ddc-Gal4/UAS-α-Syn-A53T. y1 w67c23: y1 w67c23. Dop1R: y1 w*; Mi{MIC}Dop1R1MI04437. Dop1R2: y1 w*; Mi{MIC}Dop1R2MI08664. DopEcR: w1118; PBac{PB}DopEcRc02142/TM6B, Tb1.
Figure 5—figure supplement 1.
Figure 5—figure supplement 1.. Changes in escape behavior from the first to the fourth week of life.
(a) Average walking speed as a function of age for different groups of controls (left) and mutants (right). Lines and error shades show mean and standard error. Mean speed showed significant differences among age groups (two-way ANOVA, age, f=41.38, p=9.39 x 10⁻³²; genotype, f=42.19, p=2.46 x 10⁻³²; genotype × age, f=4.36, p=2.667 x 10⁻⁸; Tukey’s post hoc test: 1 day old vs. 1 week old, p=9.92 x 10⁻⁹; 1 week old vs. 2 weeks old, p=7.34 x 10⁻⁷; 2 weeks old vs. 3 weeks old, p=0.085; 3 weeks old vs. 4 weeks old, p=0.0043). (b) Stop duration as a function of age for different groups of controls (left) and mutants (right). We found that age did not affect the duration of stops (two-way ANOVA, age, f=0.85, p=0.49; genotype, f=0.91, p=0.46; genotype × age, f=2.53, p=0.0008; Tukey’s post hoc test: 1 day old vs. 1 week old, p=0.98; 1 week old vs. 2 weeks old, p=0.992; 2 weeks old vs. 3 weeks old, p=0.578; 3 weeks old vs. 4 weeks old, p=0.9759). Lines and error shades show mean and standard error.

Update of

  • doi: 10.1101/2023.08.29.555311
  • doi: 10.7554/eLife.90905.1
  • doi: 10.7554/eLife.90905.2

Similar articles

References

    1. Ache JM, Polsky J, Alghailani S, Parekh R, Breads P, Peek MY, Bock DD, von Reyn CR, Card GM. Neural basis for looming size and velocity encoding in the Drosophila giant fiber escape pathway. Current Biology. 2019;29:1073–1081. doi: 10.1016/j.cub.2019.01.079. - DOI - PubMed
    1. Aggarwal A, Reichert H, VijayRaghavan K. A locomotor assay reveals deficits in heterozygous Parkinson’s disease model and proprioceptive mutants in adult Drosophila. PNAS. 2019;116:24830–24839. doi: 10.1073/pnas.1807456116. - DOI - PMC - PubMed
    1. Bloem BR, Okun MS, Klein C. Parkinson’s disease. Lancet. 2021;397:2284–2303. doi: 10.1016/S0140-6736(21)00218-X. - DOI - PubMed
    1. Bové J, Perier C. Neurotoxin-based models of Parkinson’s disease. Neuroscience. 2012;211:51–76. doi: 10.1016/j.neuroscience.2011.10.057. - DOI - PubMed
    1. Braine A, Georges F. Emotion in action: when emotions meet motor circuits. Neuroscience and Biobehavioral Reviews. 2023;155:105475. doi: 10.1016/j.neubiorev.2023.105475. - DOI - PubMed

MeSH terms