. 2025 Jul 9;47(7):528.
doi: 10.3390/cimb47070528.

Dihydroartemisinin Alleviates the Symptoms of a Mouse Model of Systemic Lupus Erythematosus Through Regulating Splenic T/B-Cell Heterogeneity

Affiliations

Dihydroartemisinin Alleviates the Symptoms of a Mouse Model of Systemic Lupus Erythematosus Through Regulating Splenic T/B-Cell Heterogeneity

Haihong Qin et al. Curr Issues Mol Biol. .

Abstract

Background: Systemic lupus erythematosus (SLE) is a complex autoimmune disease with significant therapeutic challenges. Recent studies suggest that dihydroartemisinin (DHA), a traditional Chinese medicine known for its anti-malarial properties, may be beneficial for SLE treatment, although its precise mechanism remains unclear. This study aimed to investigate the effects of DHA on the cellular composition and molecular events of splenic T cells and B cells in MRL/lpr mice, a widely used SLE model.

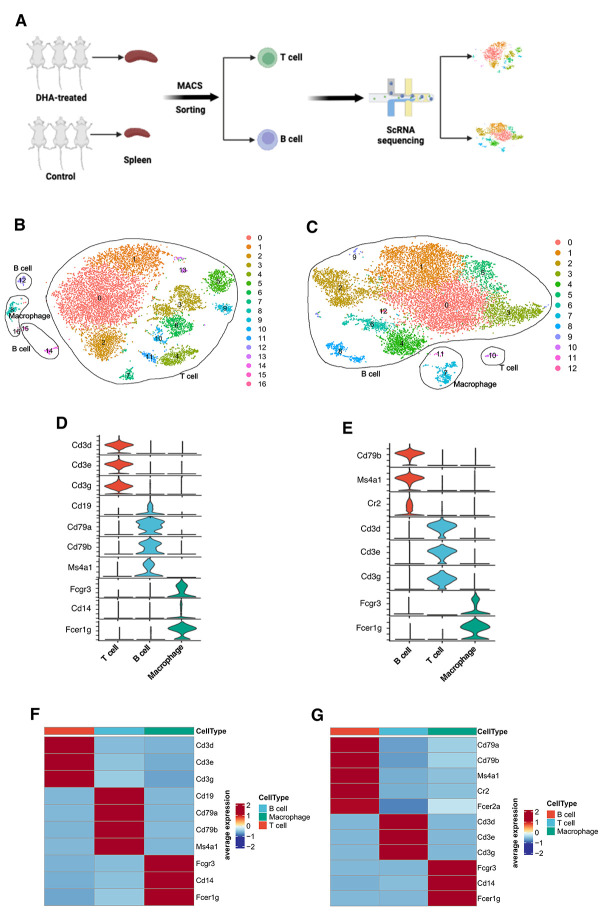
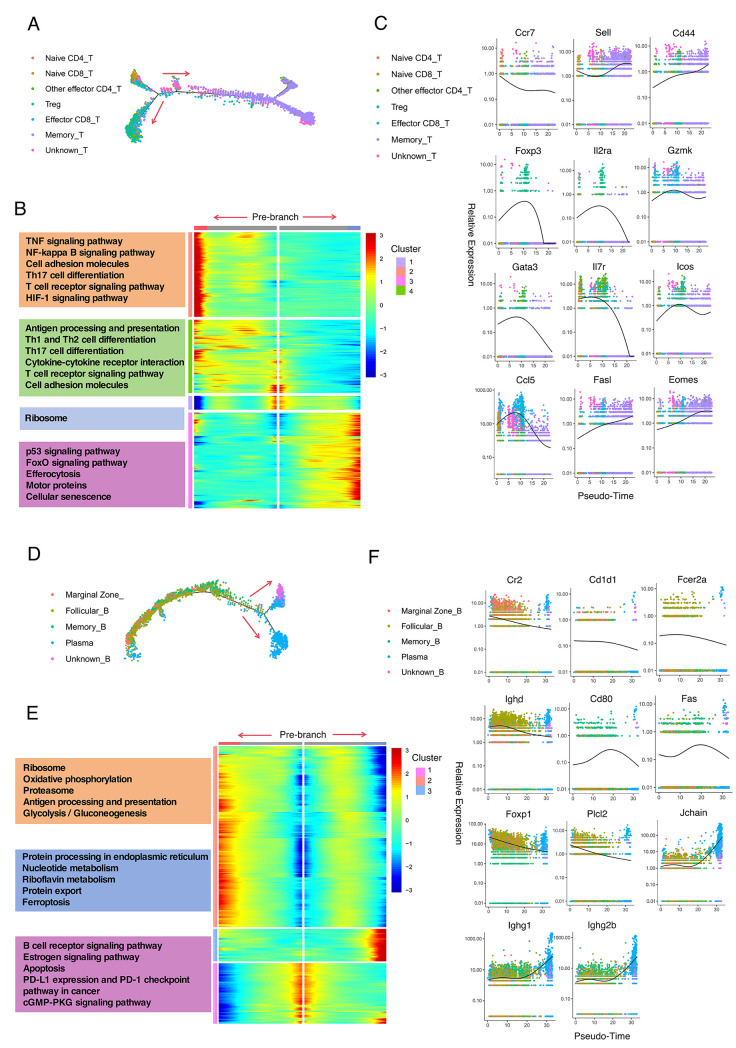
Methods: T cells and B cells isolated from the spleens of three DHA-treated mice and three control mice underwent single-cell RNA sequencing (scRNA-seq) using the 10× Genomics Chromium system. Comprehensive analyses included cell clustering, signaling pathway enrichment, pseudotime trajectory analysis, and cellular communication assessment using unbiased computational methods.

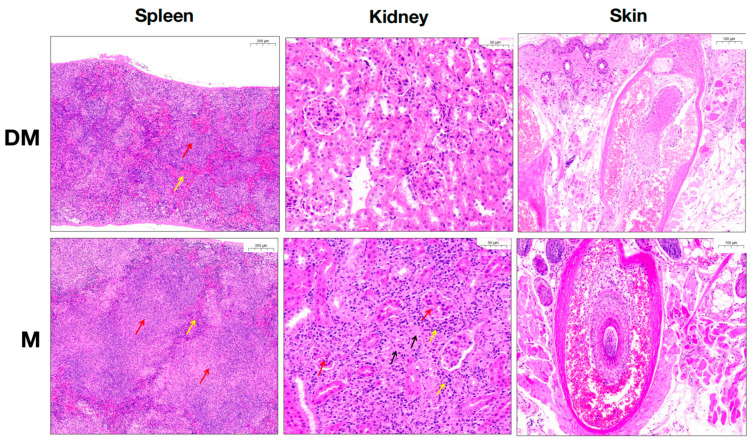
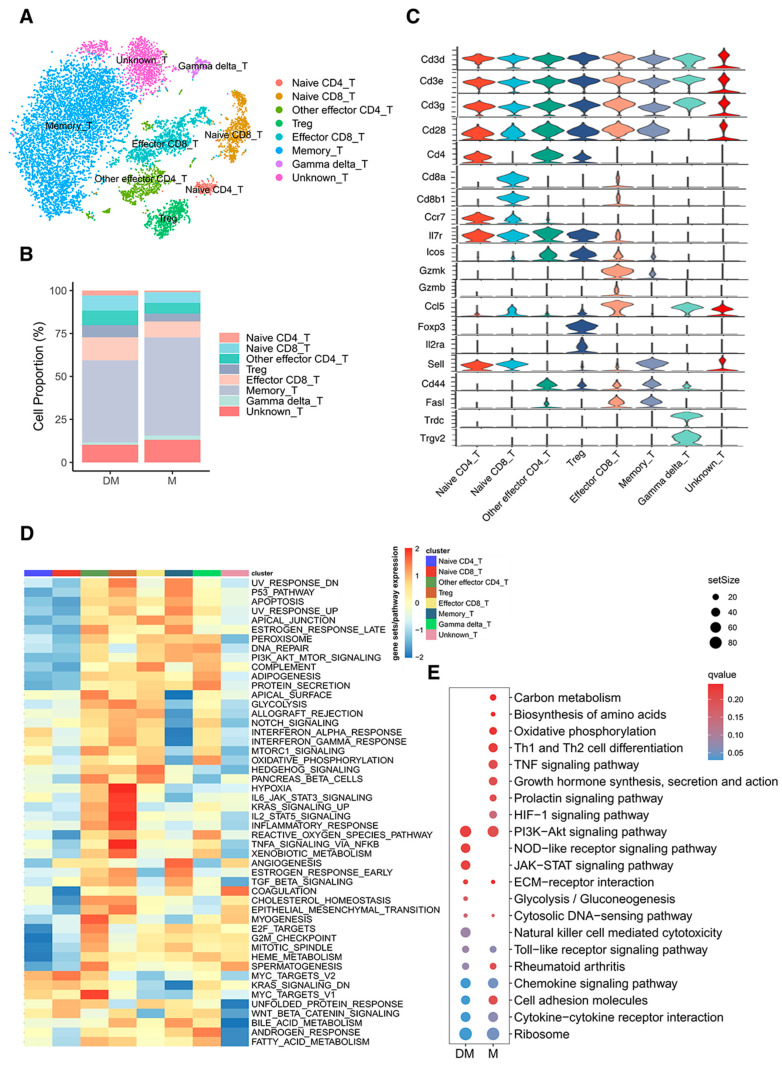
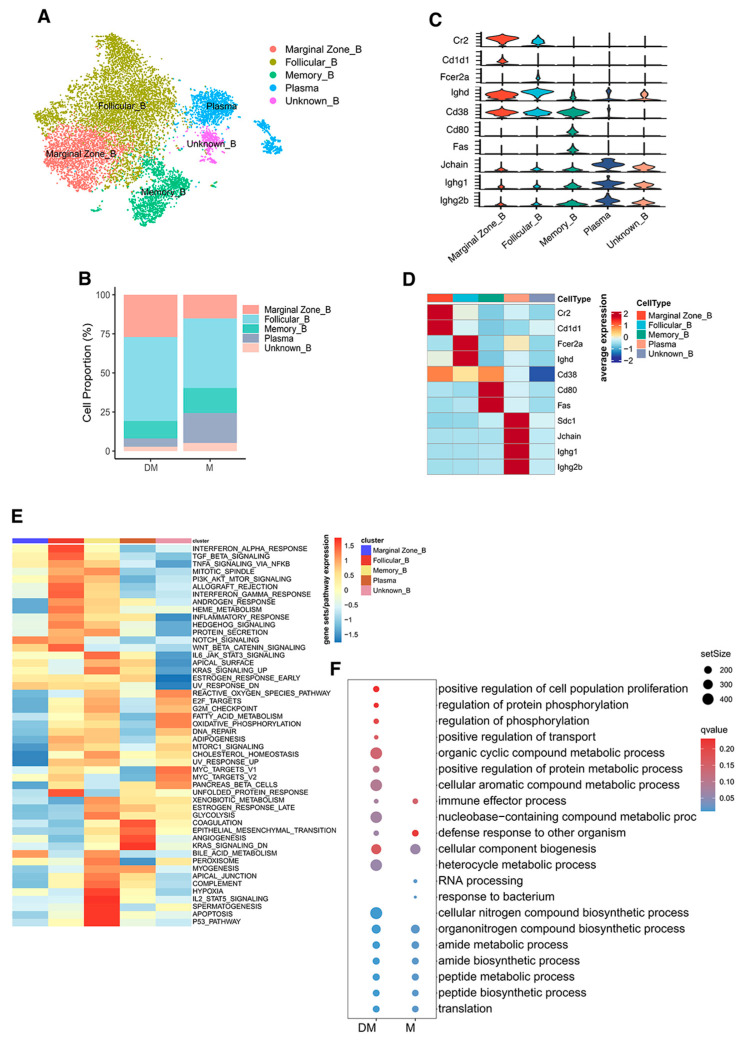
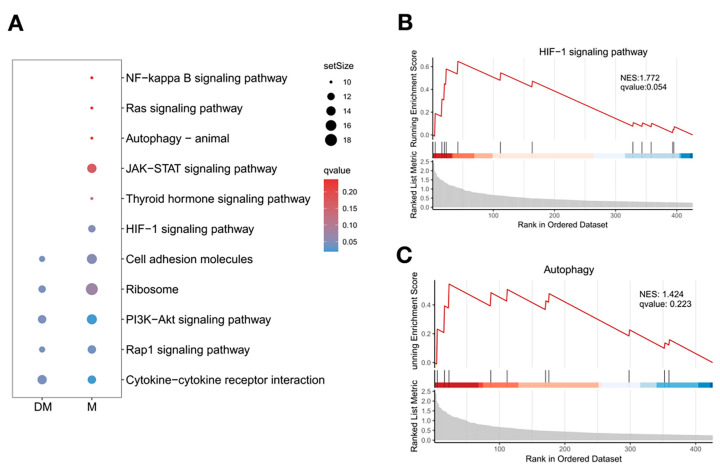
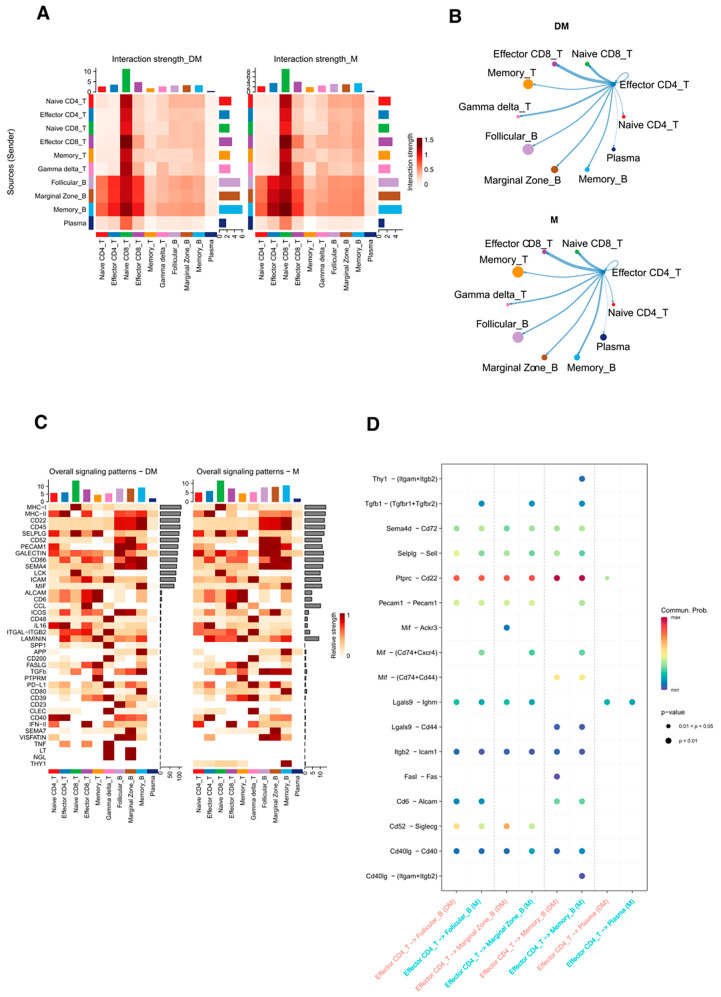
Results: DHA treatment significantly reduced kidney inflammation and altered the proportions of splenic T cells and B cells, particularly decreasing plasma cells. Molecular profiling of effector CD4+ T cells showed a significant reduction in several inflammation-related signaling pathways in DHA-treated mice. Cellular communication analysis indicated altered interactions between effector CD4+ T cells and B cells in MRL/lpr mice after DHA treatment.

Conclusions: Our findings reveal changes in cellular composition and signaling pathways in splenic T cells and B cells of MRL/lpr mice following DHA treatment. DHA may inhibit B-cell differentiation into plasma cells by modulating effector CD4+ T cells, potentially through the regulation of HIF1α and ligand-receptor interactions, enhancing our understanding of DHA's mechanisms in SLE treatment.

Keywords: dihydroartemisinin; lupus; single-cell RNA sequencing; spleen cells.


Conflict of interest statement

The authors declare that they have no competing interests.

Figures

Figure 1
Figure 1
Pathogenic changes in spleen, kidney, and skin tissue between DHA-treated and control mice. HE staining was used to observe changes in spleen, kidney, and skin in both DHA-treated and control mice. Red arrow in spleen: white pulp; yellow arrow in spleen: red pulp; red arrow in kidney: renal glomeruli; yellow arrow in kidney: inflammatory cell infiltration; black arrow in kidney: interstitial fibrous tissue proliferation. Scale bars: 50 μm (spleen), 100 μm (skin), 200 μm (kidney). Data are representative of 3 independent experiments. DM: DHA-treated mice; M: control mice.
Figure 2
Figure 2
scRNA-seq analysis of isolated T and B cells from the spleen using MACS sorting in both DHA-treated and control mice. (A): Schematic workflow of sample preparation, MACS sorting, sequencing, and bioinformatics analysis. (B,C): t-SNE visualization of main cell types in all sorted T cells (n = 11,651) with 16 clusters (B) and in all sorted B cells (n = 13,481) with 12 clusters (C). Each dot represents a cell, colored according to its cluster. (D,E): Canonical marker gene expression for each cell type of sorted T cells (D) and sorted B cells (E) shown using stacked violin plots. The violin chart is colored by cell classification, with height representing gene expression levels and width representing the ratio of gene expression. (F,G): Canonical marker gene expression for each cell type of sorted T cells (F) and sorted B cells (G) shown using heatmaps. The color corresponds to the average gene expression levels in each cell type.
Figure 3
Figure 3
Comparison of T-cell subtypes from spleens of DHA-treated and control mice. (A): t-SNE plot showing T-cell subtypes from both DHA-treated and control mice. (B): Histogram depicting the relative proportions of T-cell subtypes in DHA-treated versus control mice. (C): Stacked violin plots illustrating the expression levels of selected genes used to define T-cell subtypes. (D): Heatmap of gene sets/pathways from GSEA based on hallmark gene sets for each T-cell subtype. (E): Bubble diagram highlighting KEGG pathways enriched in T cells from DHA-treated versus control mice. DM: DHA-treated mice; M: control mice.
Figure 4
Figure 4
Comparison of B-cell subtypes in the spleen of DHA-treated and control mice. (A): t-SNE plot representing B-cell subtypes from DHA-treated and control mice. (B): Histogram showing the relative proportions of B-cell subtypes in DHA-treated versus control mice. (C,D): Stacked violin plots (C) and heatmap (D) displaying the expression levels of selected genes defining B-cell subtypes. (E): Heatmap of gene sets/pathways using GSEA based on hallmark gene sets for each B-cell subtype, performed using all differentially expressed genes. (F): Bubble diagram showing GO analysis enriched in B cells between DHA-treated and control mice. DM: DHA-treated mice; M: control mice.
Figure 5
Figure 5
Trajectory analysis of T cells and B cells from the spleen. (A,D): Trajectory plots show pseudotime trajectory analysis of T-cell (A) and B-cell (D) subtypes using Monocle 2. Arrows indicate the possible differentiation direction. (B,E): Pseudotime expression modules of T cells (B) and B cells (E) were identified by Monocle 2, illustrating cell development at main branch points. Differences in KEGG enrichment pathways across different expression modules are shown on the left. (C,F): The expression values of representative marker genes and other specific genes are plotted along the pseudotime trajectory for T cells (C) and B cells (F).
Figure 6
Figure 6
Comparison of signaling pathways in effector CD4+ T cells between DHA-treated and control mice. (A): A bubble diagram represents the KEGG pathways in effector CD4+ T cells from DHA-treated and control mice using the GSEA method. (B,C): Enrichment plots of HIF-1 signaling (B) and autophagy (C) in control mice. NES: normalized enrichment scores. DM: DHA-treated mice; M: control mice.
Figure 7
Figure 7
Ligand–receptor interactions between different cell types in DHA-treated and control mice. (A): Heatmap of interactions between cell types in DHA-treated and control mice. Column annotations represent cells from both groups. Colors indicate interaction scores. (B): Network diagram showing ligand–receptor interactions between effector CD4+ T cells and other cell types in DHA-treated and control mice. Connected lines represent communication between cells, with line thickness proportional to the number of ligand–receptor interaction events. (C): Signaling (outgoing and incoming) showing ligand–receptor interactions between T cells and B cells in DHA-treated and control mice. (D): Bubble charts representing interactions between effector CD4+ T cells and B-cell subtypes, with at least one set of cell pairs having a p-value less than 0.05. DM: DHA-treated mice; M: control mice.

Similar articles

References

    1. Tsokos G.C. Autoimmunity and organ damage in systemic lupus erythematosus. Nat. Immunol. 2020;21:605–614. doi: 10.1038/s41590-020-0677-6. - DOI - PMC - PubMed
    1. Mohamed A., Chen Y., Wu H., Liao J., Cheng B., Lu Q. Therapeutic advances in the treatment of SLE. Int. Immunopharmacol. 2019;72:218–223. doi: 10.1016/j.intimp.2019.03.010. - DOI - PubMed
    1. Basta F., Fasola F., Triantafyllias K., Schwarting A. Systemic Lupus Erythematosus (SLE) Therapy: The Old and the New. Rheumatol. Ther. 2020;7:433–446. doi: 10.1007/s40744-020-00212-9. - DOI - PMC - PubMed
    1. Möckel T., Basta F., Weinmann-Menke J., Schwarting A. B cell activating factor (BAFF): Structure, functions, autoimmunity and clinical implications in Systemic Lupus Erythematosus (SLE) Autoimmun. Rev. 2021;20:102736. doi: 10.1016/j.autrev.2020.102736. - DOI - PubMed
    1. Abid N., Manaye S., Naushad H., Cheran K., Murthy C., Bornemann E.A., Kamma H.K., Alabbas M., Elashahab M., Siddiqui H.N. The Safety and Efficacy of Rituximab and Belimumab in Systemic Lupus Erythematosus: A Systematic Review. Cureus. 2023;15:e40719. doi: 10.7759/cureus.40719. - DOI - PMC - PubMed

LinkOut - more resources