. 2025 Jul 29;23(7):e3003277.
doi: 10.1371/journal.pbio.3003277. eCollection 2025 Jul.

Mapping cerebral blood perfusion and its links to multi-scale brain organization across the human lifespan

Affiliations

Mapping cerebral blood perfusion and its links to multi-scale brain organization across the human lifespan

Asa Farahani et al. PLoS Biol. .

Abstract

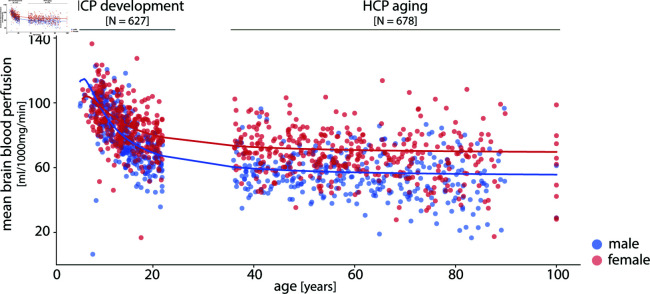
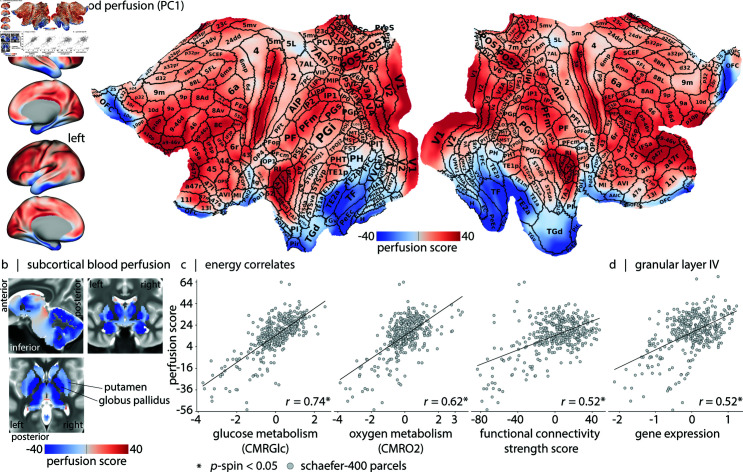
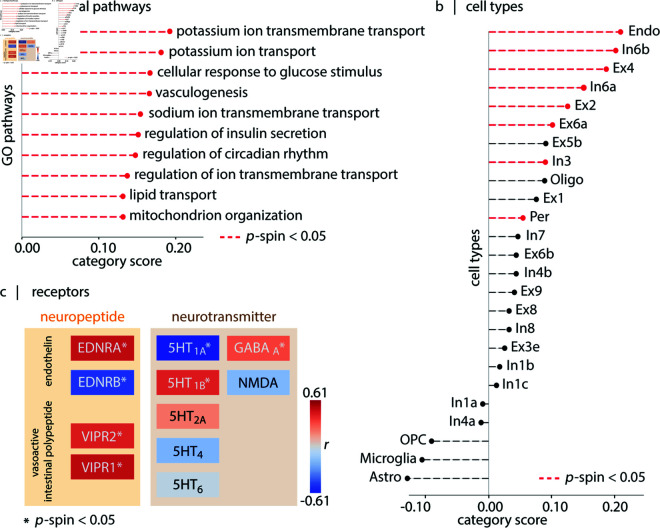
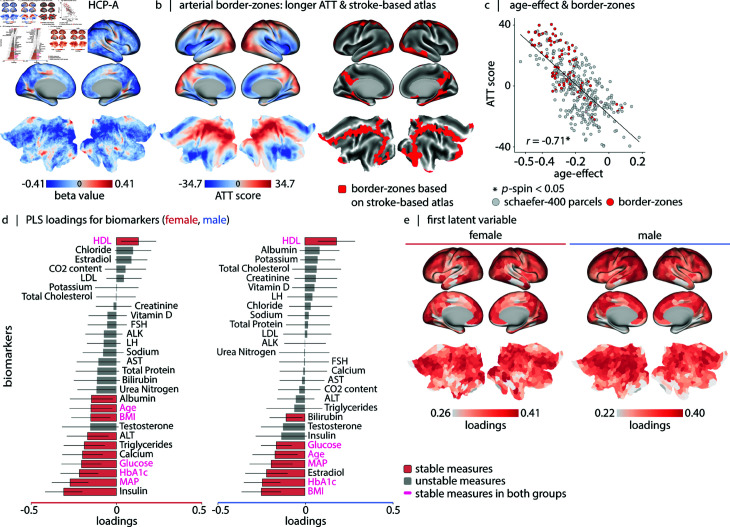
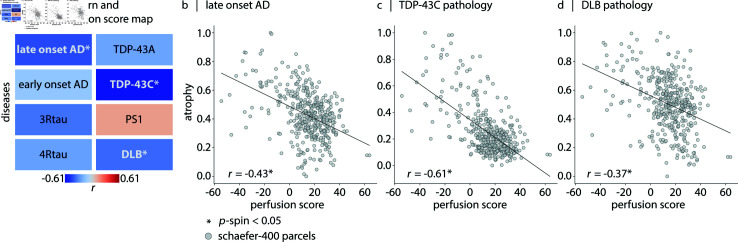
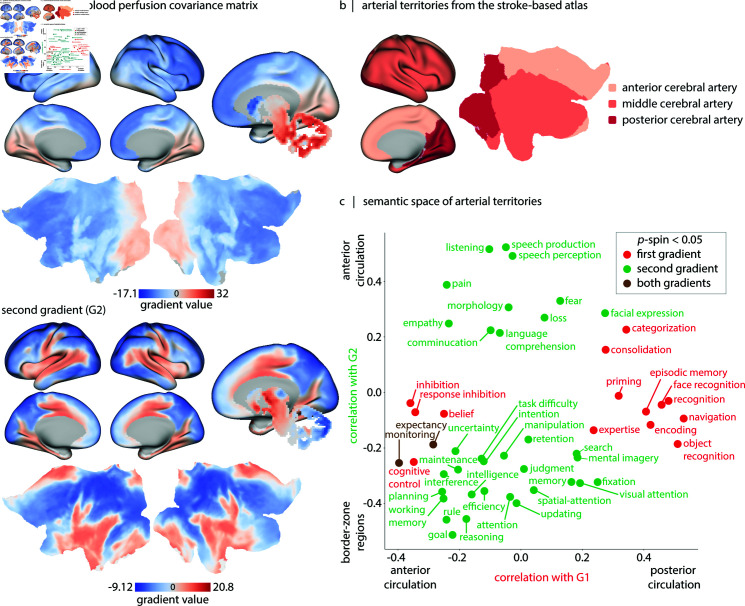
Blood perfusion delivers oxygen and nutrients to all cells, making it a fundamental feature of brain organization. How cerebral blood perfusion maps onto micro-, meso- and macro-scale brain structure and function is therefore a key question in neuroscience. Here we analyze pseudo-continuous arterial spin labeling (ASL) data from 1305 healthy individuals in the HCP Lifespan studies (5-22 and 36-100 years) to reconstruct a high-resolution normative cerebral blood perfusion map. At the cellular and molecular level, cerebral blood perfusion co-localizes with granular layer IV, biological pathways for maintenance of cellular relaxation potential and mitochondrial organization, and with neurotransmitter and neuropeptide receptors involved in vasomodulation. At the regional level, blood perfusion aligns with cortical arealization and is greatest in regions with high metabolic demand and resting-state functional hubs. Looking across individuals, blood perfusion is dynamic throughout the lifespan, follows micro-architectural changes in development, and maps onto individual differences in physiological changes in aging. In addition, we find that cortical atrophy in multiple neurodegenerative diseases (late-onset Alzheimer's disease, TDP-43C, and dementia with Lewy bodies) is most pronounced in regions with lower perfusion, highlighting the utility of perfusion topography as an indicator of transdiagnostic vulnerability. Finally, we show that ASL-derived perfusion can be used to delineate arterial territories in a data-driven manner, providing insights into how the vascular system is linked to human brain function. Collectively, this work highlights how cerebral blood perfusion is central to, and interlinked with, multiple structural and functional systems in the brain.


Conflict of interest statement

The authors have declared that no competing interests exist.

Figures

Fig 1
Fig 1. Mapping cerebral blood perfusion across participants.
Cerebral blood perfusion is estimated using arterial spin labeling (ASL) from the HCP Lifespan studies, including 627 participants (337 females) from the HCP-D (development) and 678 participants (381 females) from the HCP-A (aging). Each dot corresponds to a participant’s mean brain (grayordinates) blood perfusion level (male: blue, female: red) (See S1 Fig for the mean perfusion trajectory within white matter mask). Sex-stratified generalized additive models for location, scale and shape (GAMLSS) [76] are used to model age-related changes in blood perfusion.
Fig 2
Fig 2. Areal organization of blood perfusion.
(a) Normative blood perfusion map on lateral and medial views of the inflated and 2D flat cortical surfaces (fsLR). Borders and areal names of the multi-modal Glasser parcellation are overlaid on the flat surface [86]. The figure highlights the non-uniform distribution of perfusion scores across the cortex, with areas that have sharp gradient compared to their underlying perfusion score levels (e.g., LIPv and MT/MST) (see S1 and S2 Tables). (b) Subcortical perfusion is shown on a T2-weighted group average template. Quantification of perfusion scores according to the Tian-S4 subcortical parcellation is shown in S7 Fig [87]. A complete list of subcortical parcels is provided in S3 Table. (c) Correlations between perfusion (y-axis) and measurements of energy consumption (x-axis). Left: Correlation with glucose consumption (CMRGlc; r = 0.74, pspin=9.99×10⁴) [30]. Middle: Correlation with oxygen consumption (CMRO2; r = 0.62, pspin=9.99×10⁴) [30]. Right: Correlation with resting-state functional MRI connectivity strength (a measure of “hubness”) (r = 0.52, pspin=2.99×10³; see Methods for more details). (d) The transcriptomic signature of cortical layer IV [88] is positively correlated with perfusion (r = 0.52, pspin=2.99×10³). We do not find correspondence between blood perfusion and transcriptomic signature of supragranular (I–III) and infragranular (V–VI) cortical layers (S8 Fig).
Fig 3
Fig 3. Blood perfusion co-localizes with molecular and cellular features.
(a) The top ten GO biological processes linked with gene sets correlated with perfusion [104]. Terms are sorted based on their associated category-scores. For a complete list of genes associated with a biological pathway, category-scores and statistics, see S4 Table. (b) Cell type enrichment analysis of the cortical perfusion score map [23]. For list of genes associated with a cell type, category scores and statistics, see S5 Table. Red lines indicate statistically significant associations (after FDR-correction). (c) Comparison of perfusion with maps of neurotransmitter receptors (from PET imaging) and neuropeptide receptors (from transcriptomics) [18,106]. Colors indicate directions of association (red: positive, blue: negative) and asterisks indicate significant associations. See S9 Fig for results obtained using a multivariate model with dominance analysis. Methodological details about each neurotransmitter receptor PET map are provided in S6 Table.
Fig 4
Fig 4. Blood perfusion across development.
(a) Whole-brain perfusion (y-axis), stratified by age (x-axis) and biological sex (male: blue, female: red). S7 Table shows statistical comparisons between males and females in each age bin. (b) Age-effect perfusion map estimated using data from 627 participants in the HCP-Development dataset (5–22 years). Linear age coefficients (β1) are derived from a linear model (CBFi=β0+β1×age+β2×sex), applied at each vertex/voxel i. Subcortical age-effect values are shown in S11A Fig. Sex-effect and coefficient significance maps are provided in S12 Fig. S13 Fig shows vertex/voxel-wise Spearman correlation maps of blood perfusion and age, stratified by biological sex. See S14 and S15 Figs for sex-stratified non-linear modeling of perfusion changes. (c) Mean age-effect on cerebral perfusion, stratified into unimodal and transmodal cortex (unimodal: visual and somatomotor networks, shown in green; transmodal: frontoparietal and default mode networks, shown in yellow; canonical intrinsic functional networks from Yeo et al. [124]). The age-effect difference (Δβ1=|0.62|) is significant using both t-tests (t = 12.97, p=2.03×1030) and non-parametric spin tests (pspin=9.99×10⁴). (d) Correlation between cerebral blood perfusion changes (y-axis) and cortical thickness changes (x-axis) (r = 0.33, pspin=3.99×10³). (e) Correlation between cerebral blood perfusion changes (y-axis) and developmental cortical expansion (x-axis) (r = −0.38, pspin=9.99×10⁴) [125]. In (c), (d) and (e) maps are parcellated according to Schaefer-400 atlas [126].
Fig 5
Fig 5. Blood perfusion across aging.
(a) Age-effect perfusion map estimated using data from 678 participants in the HCP-Aging dataset (36–100 years). Linear age coefficients (β1) are derived from a linear model (CBFi=β0+β1×age+β2×sex), applied at each vertex/voxel i. Subcortical age-effect values are shown in S11B Fig. Sex-effect and coefficient significance maps are provided in S16 Fig. S17 Fig shows vertex/voxel-wise Spearman correlation maps of blood perfusion and age, stratified by biological sex. See S18 Fig for sex-stratified non-linear modeling of perfusion changes. (b) The age-effect pattern aligns with arterial border-zone cortical regions. The border-zone areas are described based on: (1) Left: First principal component of estimated arterial transit time maps (greater values correspond to regions with later arterial transit time; see S19 Fig for analysis details). In the figure, “ATT” stands for arterial transit time. (2) Right: Intersections of major cerebral arterial territories derived from a stroke-based atlas [142,143]. (c) Correlation between cerebral blood perfusion age-related changes (x-axis) and arterial transit time scores (y-axis) (r = −0.71, pspin=9.99×10⁴). Red dots represent border-zone regions defined according to (2). (d) Using partial least squares (PLS) analysis, we find a significant latent variable that accounts for 82.0%, and 90.6% of the covariance between cortical blood perfusion and biomarkers (S20 Fig) in male and female participants (in both cases: p=9.99×10⁴). The bar plot visualizes the contribution of individual biomarkers to the first latent variable. The significance of each biomarker’s contribution to the overall pattern is assessed by bootstrap resampling (1000 bootstraps; see S21 Fig). (e) The brain loadings of the first latent variable are shown for both groups. These maps correlate with the arterial transit time score map shown in (b) (male: r = 0.47, pspin=0.027, female: r = 0.52, pspin=9.99×10⁴). Brain maps in (a), (b) and (e) are shown on the inflated and 2D flat cortical surfaces (fsLR); maps in (b)-right and (e) are parcellated according to the Schaefer-400 functional atlas [126]. Results of PLS analysis after regressing out the linear effect of age and sex from the perfusion maps and the biomarkers are presented in S22 Fig.
Fig 6
Fig 6. Cerebral blood perfusion and susceptibility to neurodegeneration.
(a) Comparison of perfusion with eight pathology-confirmed disease atrophy maps (voxel-based morphometry; VBM data from Harper et al. [159]), both parcellated using the Schaefer-400 functional atlas [126]. Colors indicate directions of association (red: positive, blue: negative) and asterisks indicate significant associations. (b) Late-onset Alzheimer’s disease (r = −0.43; FDR-corrected, pspin=3.99×10³), (c) TDP-43C (r = −0.61; FDR-corrected, pspin=3.99×10³), (d) and dementia with Lewy bodies (r = −0.37; FDR-corrected, pspin=5.32×10³) show significant negative correlations with the perfusion map, indicating that these disease-specific atrophy patterns co-localize with areas of lower cerebral perfusion.
Fig 7
Fig 7. Data-driven mapping and functional annotation of vascular territories.
(a) The first two gradients of blood perfusion covariance matrix are shown on the inflated and 2D flat cortical surfaces (fsLR), and subcortical regions are shown on a subcortical mask (from HCP-S1200 release). (b) The arterial territories for posterior cerebral artery, middle cerebral artery and anterior cerebral artery from an independent stroke-based atlas [142,143]. (c) Correlation values between cortical gradient maps and Neurosynth meta-analytic atlas (x-axis: correlations with gradient 1; y-axis: correlations with gradient 2). Here, only functional/cognitive terms with correlation values exceeding thresholds determined by spatial auto-correlation-preserving permutation nulls (pspin > 0.05) are annotated; for a list of 124 included Neurosynth functional/cognitive terms refer to S8 Table.

Similar articles

References

    1. Betzel RF, Bassett DS. Multi-scale brain networks. NeuroImage. 2017;160:73–83. doi: 10.1016/j.neuroimage.2016.11.006 - DOI - PMC - PubMed
    1. Presigny C, De Vico Fallani F. Colloquium: multiscale modeling of brain network organization. Rev Mod Phys. 2022;94(3). doi: 10.1103/revmodphys.94.031002 - DOI
    1. Hestrin S, Armstrong WE. Morphology and physiology of cortical neurons in layer I. J Neurosci. 1996;16(17):5290–300. doi: 10.1523/jneurosci.16-17-05290.1996 - DOI - PMC - PubMed
    1. Migliore M, Shepherd GM. An integrated approach to classifying neuronal phenotypes. Nat Rev Neurosci. 2005;6(10):810–8. doi: 10.1038/nrn1769 - DOI - PubMed
    1. Yuste R. From the neuron doctrine to neural networks. Nat Rev Neurosci. 2015;16(8):487–97. doi: 10.1038/nrn3962 - DOI - PubMed

LinkOut - more resources