. 2025 Nov;12(41):e01977.
doi: 10.1002/advs.202501977. Epub 2025 Jul 29.

A Prion-Like Domain in EBV EBNA1 Promotes Phase Separation and Enables SRRM1 Splicing

Affiliations

A Prion-Like Domain in EBV EBNA1 Promotes Phase Separation and Enables SRRM1 Splicing

Xiaoyue Zhang et al. Adv Sci (Weinh). 2025 Nov.

Abstract

Epstein-Barr virus (EBV) nuclear antigen 1 (EBNA1) is necessary to maintain stability of EBV episomes, EBV replication, and causes host genomic instability and promotes tumor cells survival. Recent studies have shown that viruses utilize liquid-liquid phase separation (LLPS) within host cells to form sub-cellular compartments known as "virus factories". Prion-like domains (PrLDs), which resemble structural domains of low complexity, are shown to drive LLPS in vivo. In the current study, a PrLD is identified in EBNA1 and aggregation of EBNA1 proteins is observed in EBV-positive tumors. EBNA1 condensate interacting molecules are examined and are found that EBNA1 interacts with the splicing factor SRSF1 to regulate alternative splicing of SRRM1 and promote tumor progression. Deleting the EBNA1 PrLD results in defects in protein aggregation, LLPS, alternative splicing regulation, and nasopharyngeal carcinoma cells proliferation. Targeting the PrLD of EBNA1 inhibits the formation of protein aggregation, promotes alternative splicing of SRRM1, and inhibits the progression of nasopharyngeal carcinoma. Here, we report for the first time that EBNA1, a protein from the human oncogenic virus EBV, is a prion-like protein, combining algorithm prediction and experimental validation. That implies a possible molecular pathogenic mechanism of EBNA1 in neurodegenerative diseases.

Keywords: EBV‐encoded nuclear antigen 1; alternative splicing; phase separation; prion‐like domain; protein aggregation.


Conflict of interest statement

The authors declare no conflict of interest.

Figures

Figure 1
Figure 1
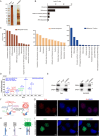
EBV EBNA1 possesses a prion‐like domain and exhibits protein aggregation properties. A) Prediction of prion‐like domains of EBNA1 based on its amino acid positions and sequences was performed using the PLAAC database (http://plaac.wi.mit.edu/). The red line represents the prediction of the prion‐like domain, and if the red line is above the black line, it represents a prion‐like region. The EBNA1 prion‐like region was compared with the EBNA1 amino acid structural domain. B) The SDD‐AGE and SDS‐PAGE assays were performed to detect the expression of endogenous EBNA1 protein aggregates and monomers in multiple cell lines: BJAB (EBV‐negative), Raji (EBV‐positive), Akata (EBV‐negative), B95.8 (EBV‐positive), AGS (EBV‐negative), AGS‐EBV (EBV‐positive), HONE1(EBV‐negative) and HONE‐EBV (EBV‐positive). C) HEK‐293 and SGC7901 cells were transfected with the Flag‐tagged EBNA1 plasmid for 48 h. The expression of exogenous EBNA1 proteins was detected by SDS‐AGE and SDS‐PAGE. D) HEK‐293 cells were transfected with Flag‐tagged EBNA1 plasmid for 48 h, and the cell precipitates were collected and fixed. The ultrathin sections (around 50–70 nm) were prepared and placed on a 200‐mesh gold mesh. They were incubated with anti‐EBNA1 antibody at 4 °C overnight and goat anti‐mouse IgM/Gold (10 nm) secondary antibody for 1 h at room temperature. The subcellular localization of EBNA1 protein aggregates was detected by transmission electron microscopy. The yellow arrow indicates the cell's nuclear membrane. E) Schematic representation of a series of truncated vectors with Flag‐tagged EBNA1 structural domains. F) HEK‐293 cells were transfected with Flag‐tagged EBNA1 truncated plasmids for 48 h, separately. The expression of EBNA1 protein aggregates was detected by SDD‐AGE analysis. G) Gastric cancer tissue samples (either EBER+ or EBER‐) were collected for immunofluorescence and thioflavin T (final concentration of 400 mM) staining. Co‐localization of Cy3‐labeled EBNA1 with thioflavin T green fluorescence was observed by fluorescence microscopy. Cy3 labels EBNA1; Thioflavin T: green fluorescence, labels amyloid aggregates; DAPI: labels nuclei. Scale bar: 20 µm.
Figure 2
Figure 2
The yeast Sup35‐based prion assay is used to detect EBNA1 prion‐like behavior.A–D) The yeast cells expressing EBNA1‐PrLD‐Sup35MC plated on complete medium (1/4 YPD). [EBNA1‐PrLD +] was phenotypically similar to [PSI +], producing white colonies, which could be distinguished from [ebna1‐prld ] strains by red pigments accumulated through the adenine biosynthesis pathway (A, B top). Both phenotypes were stably maintained during repeated cell passaging (B, middle). [ebna1‐prld ] strains spontaneously generated[EBNA1‐PrLD +] clones at a low frequency (B, bottom). White arrows indicate [EBNA1‐PrLD +] clones, and red arrows indicate [ebna1‐prld ] clones. 5‐Fold serial dilutions of [PSI +], [psi ], [EBNA1‐PrLD +], and [ebna1‐prld ] clone were individually spotted onto complete (1/4YPD) medium (C) and adenine‐deficient medium (SD/‐Ade)(D, right). E) Comparable characteristics of EBNA1‐PrLD‐Sup35MC, EBNA1‐△PrLD‐Sup35MC and full‐length Sup35 in yeast. Fivefold serial dilutions of these clones were individually spotted onto complete (1/4YPD) medium and adenine‐deficient medium (SD/‐Ade).
Figure 3
Figure 3
The prion‐like domain of EBNA1 drives phase separation. A) HEK‐293 cells transfected with EGFP‐EBNA1 plasmid were treated with 3% of 1,6‐hexanediol for 15 s. The upper panel is a representative image of the spot changes of EGFP‐EBNA1. B,C) HEK‐293 cells were transfected with EGFP‐EBNA1 plasmid for fluorescence recovery after photobleaching assay. A representative image is shown. The yellow circle highlights the spot undergoing targeted bleaching (B). Quantification of FRAP fluorescence intensity data of EGFP‐EBNA1 spots, normalized to 100% by maximum fluorescence intensity (C). D,E) HEK‐293 cells were transfected with EGFP‐EBNA1‐WT or EGFP‐EBNA1‐△90‐325 truncated plasmid for immunofluorescence imaging. Laser confocal detection of EBNA1 liquid condensate formation in the nucleus. 2D fluorescence images are shown in (D), and 3D fluorescence images are shown in (E).
Figure 4
Figure 4
EBNA1 interacts with components of the splicing machinery. A) Raji cell protein lysates were collected and immunoprecipitated with anti‐EBNA1 antibody, and the precipitated proteins were analyzed by SDS‐PAGE assay and mass spectrometry. B,C) KEGG (B) and GO enrichment analyses (C) were performed to detect the major signaling pathways enriched for EBNA1 interacting proteins using the mass spectrometry data. D) Immunoprecipitation combined with mass spectrometry analysis showed the peak of the SRSF1 peptide, indicating that SRSF1 was present in the EBNA1 precipitate complex. E) Immunoprecipitations were performed with anti‐EBNA1, anti‐SRSF1 antibody or normal anti‐IgG antibody in Raji cells or GM12878 cells. F,G) Proximity ligation assay was performed to detect the interaction between EBNA1 and SRSF1 in Raji cells. Model diagram of Proximity Ligation Assay (F). Fluorescence microscopy was performed to observe the fluorescence co‐localization of EBNA1 with SRSF1 (G). H,I) HEK‐293 cells were transfected with pBiFC‐VC‐SRSF1 and pBiFC‐VN‐EBNA1 plasmids for 48 h, and then a bimolecular fluorescence complementation assay was performed. Model diagram of Bimolecular fluorescence complementation (H). The fluorescence expression of EBNA1 and SRSF1 was detected by fluorescence microscopy (I). Scale bar: 20 µm.
Figure 5
Figure 5
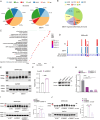
EBNA1 modulates cellular alternative splicing events and regulates SRRM1 exon skipping. A) HEK‐293 cells were transfected with either the EBNA1 expression vector or the empty vector (NC) for 48 h. The proportion of alternative splicing events in both cells is revealed by a third‐generation sequencing platform. SE: exon skipping, RI: intron retention, A5SS: alternative 5′ splice sites, A3SS: alternative 3′splice sites, AFE: alternative first exon, ALE: alternative last exon, MXE: mutually exclusive exon. B) The proportion of EBNA1‐regulated differentially alternative splicing events (EBNA1 vs NC). C) GO enrichment analysis of the biological functions of EBNA1‐regulated differentially alternative spliced genes. D) Normalized sequencing reads count the relative expression of each exon of the SRRM1 gene. Red bars indicate that EBNA1‐specific isoforms shown with exon arrangement and alternative splicing sites. E) The red arrow marks the position of EBNA1‐regulated SRRM1 alternative splice isoforms. GAPDH was used as a loading control. F) The relative expression of the SRRM1(+) isoform was shown. G,H) HONE1 cells were transfected with the indicated siRNAs for 48 h to detect SRSF1 protein (G) and mRNA expression (H). I) HONE1 cells were transfected with Flag‐EBNA1 with or without siSRSF1‐3 for 48 h. Cells were collected for RT‐PCR to detect SRRM1 alternative splice isoforms. GAPDH was used as a loading control. RT‐qPCR was tested on three biological replicates. J) HONE1 cells transfected with Flag‐EBNA1 or Flag‐EBNA1△90‐325 plasmids for 48 h. Cells were collected for RT‐PCR and agarose gel electrophoresis. Red arrows indicate the positions of SRRM1 alternative splice isoforms. RT‐PCR was tested on three biological replicates. These data are shown as the Mean ± SD. *P < 0.05, **P < 0.01, ***P < 0.001.
Figure 6
Figure 6
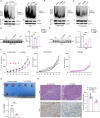
EBNA1‐mediated SRRM1(+) splice isoform facilitates malignant phenotype in tumor cells. A) The protein expression levels of SRRM1 in various gastric and nasopharyngeal carcinoma cells were assayed by Western blotting. B) Patterns of different splice isoforms generated after an exon‐skipping event in SRRM1. C–E) HONE1, AGS, and 6–10B cells were transfected with Flag‐SRRM1 (+) or Flag‐SRRM1 (−) plasmids, respectively. Then, CCK8 (C), Clone formation (D), and Transwell assays (E) were performed to detect tumor cell proliferation and cell migration abilities. The experiments were independently repeated three times, and the results are presented as mean ± SD. F–H) HONE1 cells stably transfected with Flag‐SRRM1(+) or Flag‐SRRM1(−) plasmids were subcutaneously implanted BALB/c nude mice to establish a xenograft growth model. The tumor volume was measured every three days, and growth curves were plotted (F). When the tumor cells grew for 25 days, the mice were euthanized and the tumor tissues were removed. The tumor volumes of each group were recorded (G) and tumor tissues were weighed (H). Each group has 5 mice. I)H&E staining and immunohistochemical analysis of tumor tissue morphology and Ki67 expression levels. J) TUNEL staining was performed to detect the level of apoptosis in tumor tissues of different treatment groups. These data are shown as the mean ± SD. Scale bar: 100 µm.*P < 0.05, **P < 0.01, ***P < 0.001, ns, not significant.
Figure 7
Figure 7
Pharmacological targeting of prion‐like domain inhibits EBNA1 protein aggregate formation, promotes SRRM1 alternative splicing and inhibits tumor progression. A–C) Raji (A), HONE1‐EBV (B), and HEK‐293‐EBNA1 (C) cells were treated with HSP90 inhibitor 17‐DMAG or 17‐AAG for 48 hours. The expression of endogenous EBNA1 prion‐like protein aggregates was detected by SDD‐AGE and SDS‐PAGE analysis. D,E) RT‐PCR and agarose gel electrophoresis experiments were performed to detect the SRRM1 alternative splice isoform in HONE1‐EBV (D) and Raji (E) cells. Red arrows indicate the position of SRRM1 splice isoforms. The relative expression values of the splice isoforms are plotted (right panel). RT‐PCR was detected on three biological replicates. F,G) HONE1‐EBV cells were implanted subcutaneously into BALB/C nude mice, and these mice were treated with 17‐DMAG (total cumulative dose 28 mg kg−1). Mice were randomly grouped into (a) normal saline (saline injection group) and (b) 17‐DMAG group (n = 5, each group). Growth curves of HONE1‐EBV xenograft tumors subcutaneously in different treatment groups are shown (F). Red arrows indicate that the administration treatment was performed at that time (F). Macroscopic images and the excised tumor weights in each group are presented (G). H) H&E staining and immunohistochemistry were performed to assess tumor tissue morphology and expression levels of Ki67. Scale bar: 100 µm. The data is shown as the Mean ± SD. **p < 0.01,***p < 0.001, ns, not significant.
Figure 8
Figure 8
Diagram illustrating the mechanism by which EBV EBNA1 with prion‐like domains regulates the alternative splicing of SRRM1. Briefly, the prion‐like domain of EBNA1 drives protein aggregation, which in turn drives liquid–liquid phase separation. Through this mechanism, EBNA1 interacts with SRSF1 to influence the host's alternative splicing pattern. Notably, this interaction modulates the expression of the SRRM1 splicing isoforms, resulting in the production of two distinct splicing isoforms: SRRM1(+) and SRRM1(−). Intriguingly, these isoforms exhibit opposing roles in the regulation of tumor progression, highlighting the functional significance of EBNA1‐mediated splicing alterations.

References

    1. Young L. S., Rickinson A. B., Nat. Rev. Cancer 2004, 4, 757. - PubMed
    1. Young L. S., Yap L. F., Murray P. G., Nat. Rev. Cancer 2016, 16, 789. - PubMed
    1. Wong Y., Meehan M. T., Burrows S. R., Doolan D. L., Miles J. J., J. Cancer Res. Clin. Oncol. 2022, 148, 31. - PMC - PubMed
    1. Dunmire S. K., Verghese P. S., Balfour H. H. Jr., J. Clin Virol. 2018, 102, 84. - PubMed
    1. Hussein K., Rath B., Ludewig B., Kreipe H., Jonigk D., Eur. J. Cancer 2014, 50, 2417. - PubMed

MeSH terms

LinkOut - more resources