. 2025 Aug 13;33(8):1347-1362.e5.
doi: 10.1016/j.chom.2025.07.004. Epub 2025 Jul 28.

The prototypic crAssphage is a linear phage-plasmid

Affiliations

The prototypic crAssphage is a linear phage-plasmid

Danica T Schmidtke et al. Cell Host Microbe. .

Abstract

The prototypic crAssphage (Carjivirus communis) is an abundant, prevalent, and persistent human gut bacteriophage, yet it remains uncultured and its lifestyle uncharacterized. C. communis does not readily plaque, suggesting a largely non-lytic lifestyle. Here, we find that C. communis is a linear phage-plasmid that stably persists extrachromosomally within its host. Plasmid and phage-related genes are transcribed, and multiple putative replication origins may initiate replication for multiple lifestyles and genome conformations, including both circular and linear formations. Leveraging these findings, we use a plaque-free culturing approach to measure C. communis replication on prevalent gut bacteria, notably Phocaeicola vulgatus, P. dorei, and Bacteroides stercoris, revealing a broad host range. C. communis persists without causing major cell lysis events or integrating into host chromosomes. Taken together, C. communis' ability to switch between phage and plasmid lifestyles within a wide range of hosts may contribute to its widespread presence in human gut microbiomes.

Keywords: Bacteroidota; Carjivirus communis; Phocaeicola; bacteriophage; crAssphage; microbial genomics; microbiome; phage culturing; phage-plasmid; plasmid.


Conflict of interest statement

Declaration of interests I.L. is an employee and shareholder of Phase Genomics, Inc., which commercializes proximity-ligation technology.

Figures

Figure 1.
Figure 1.. The C. communis genome encodes both phage and plasmid features
A) The C. communis genome. Gene color denotes strand orientation (forward = green, reverse = black). Purple text denotes protein annotations identified in this manuscript B) protein alignment of MobC in C. communis and its closest plasmid relative. Also see figure S1.
Figure 2.
Figure 2.. Expression of C. communis genes in metatranscriptomics
A) Positive stranded genes in green, negative stranded genes in black. Each dot represents average expression of one gene across 43 C. communis positive metatranscriptomics samples (average expression <10 not shown) B) Ratio of average positive strand gene expression:average negative strand gene expression in each of the 43 C. communis positive metatranscriptomics samples Also see figure S2.
Figure 3.
Figure 3.. Putative origins of replication in C. communis
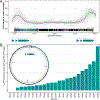
A) GC skew plot of the C. communis genome. Arrows on top of the GK skew plot represent genes in the C. communis genome. The vertical dotted line represents the terminus B) Genetic context of the predicted origins of replication (gray boxes), aligned to the GC skew in that region of the genome.
Figure 4.
Figure 4.. C. communis genome structure
A) Schematic of Hi-C sequencing (BioRender) B) Hi-C map of C. communis internal links C) fold-change in median coverage (y-axis) of Oxford Nanopore sequencing of C. communis-containing stool samples across the C. communis genome (x-axis) D) Number of read ends, excluding soft-clipped, in long read Oxford Nanopore sequencing normalized to coverage (y-axis) across the C. communis genome (x-axis). Also see figure S3.
Figure 5.
Figure 5.. Assembled C. communis genome in both putative conformations
A) Fold change in median coverage from Oxford Nanopore metagenomic sequencing across C. communis genome assemblies corrected to a linear form with DTRs. Gene color represents function. Transparent blue boxes = putative origins. Red outlined boxes = DTRs, zoom-in boxes = genes inside the DTRs B) Percent of total reads that map to the DTR region that span the entire DTR (y-axis) in each of the Oxford Nanopore metagenomic sequencing samples (x-axis). Transparent blue boxes = putative origins. Red outlined boxes = DTRs, zoom-in boxes = genes inside the DTRs. Also see figure S4.
Figure 6.
Figure 6.. ProxiMeta Hi-C sequencing for bacterial host prediction of C. communis
A) Schematic of Hi-C sequencing for host prediction (BioRender) B) Plot of bacterial MAG abundance (x-axis) vs. C. communis-bacterial “links” (y-axis). The dotted line represents the best fit line. P-values represent whether the deviation of the point from the best fit line is significant. To calculate P-values, Z-scores were calculated and a threshold of 3 was set to determine data points that deviated from the best fit line by 3 standard deviations. Z-scores were then converted to P-values C) Distribution of C. communis-P. vulgatus links across the C. communis genome (y-axis) and the P. vulgatus genome (x-axis). Also see figure S5.
Figure 7.
Figure 7.. C. communis replication in isolate bacterial cultures
A) Copies of C. communis per mL of culture measured via qPCR (green solid line), CFU per mL of culture of P. vulgatus with phage filtrate (green dotted line) and without phage filtrate (black dotted line); * denotes that CFU per mL with and without phage filtrate added are statistically significantly different (p-value <0.05, Welch’s t-test). (in the minus phage filtrate condition copies of C. communis are undetected) B) Copies of C. communis per mL of culture measured via qPCR (green solid line), CFU per mL of culture of P. dorei with phage filtrate (green dotted line) and without phage filtrate (black dotted line); * denotes that CFU per mL with and without phage filtrate added are statistically significantly different (p-value <0.05, Welch’s t-test). (in the minus phage filtrate condition copies of C. communis are undetected) C) Ratio of C. communis:P. vulgatus in P. vulgatus culture (black). Ratio of C. communis:P. dorei in P. dorei culture (green). D) C. communis:P. vulgatus ratio of genome length corrected coverage in publicly available single-cell microbiome sequencing. Horizontal dotted line represents the median E) Intracellular (green), extracellular (black), and total (purple) copies of C. communis in culture with P. vulgatus over time. Gray line represents the negative control where the same amount of phage stock was added to media alone (no bacteria) F) Intracellular (green), extracellular (black), and total (purple) copies of C. communis in culture with P. dorei over time. Gray line represents the negative control where the same amount of phage stock was added to media alone (no bacteria). Also see figures S6–S7.

References

    1. Pinto Y, Chakraborty M, Jain N, & Bhatt AS (2023). Phage-inclusive profiling of human gut microbiomes with Phanta. Nature Biotechnology. 10.1038/s41587-023-01799-4 - DOI - PubMed
    1. Dutilh BE, Cassman N, McNair K, Sanchez SE, Silva GGZ, Boling L, Barr JJ, Speth DR, Seguritan V, Aziz RK, Felts B, Dinsdale EA, Mokili JL, & Edwards RA (2014). A highly abundant bacteriophage discovered in the unknown sequences of human faecal metagenomes. Nature Communications, 5(1), 4498. 10.1038/ncomms5498 - DOI - PMC - PubMed
    1. Colavecchio A, Cadieux B, Lo A, & Goodridge LD (2017). Bacteriophages Contribute to the Spread of Antibiotic Resistance Genes among Foodborne Pathogens of the Enterobacteriaceae Family – A Review. Frontiers in Microbiology, 8, 1108. 10.3389/fmicb.2017.01108 - DOI - PMC - PubMed
    1. Jahn MT, Arkhipova K, Markert SM, Stigloher C, Lachnit T, Pita L, Kupczok A, Ribes M, Stengel ST, Rosenstiel P, Dutilh BE, & Hentschel U (2019). A Phage Protein Aids Bacterial Symbionts in Eukaryote Immune Evasion. Cell Host & Microbe, 26(4), 542–550.e5. 10.1016/j.chom.2019.08.019 - DOI - PubMed
    1. Klimenko AI, Matushkin YG, Kolchanov NA, & Lashin SA (2016). Bacteriophages affect evolution of bacterial communities in spatially distributed habitats: A simulation study. BMC Microbiology, 16(S1), S10. 10.1186/s12866-015-0620-4 - DOI - PMC - PubMed

LinkOut - more resources