Comparative Study
. 2025 Jul 29;15(1):27700.
doi: 10.1038/s41598-025-08778-6.

Comparing non-machine learning vs. machine learning methods for Ki67 scoring in gastrointestinal neuroendocrine tumors

Affiliations
Comparative Study

Comparing non-machine learning vs. machine learning methods for Ki67 scoring in gastrointestinal neuroendocrine tumors

Nazanin Mola et al. Sci Rep. .

Abstract

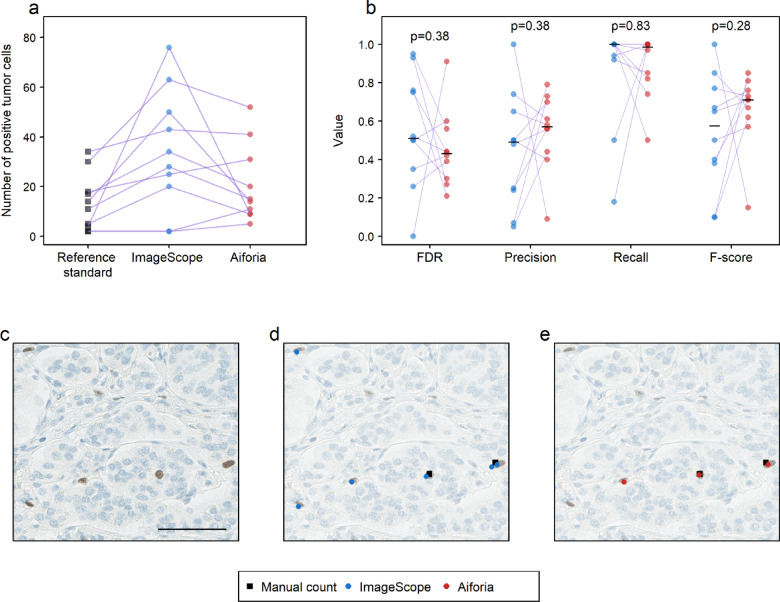
The Ki67 score is a crucial prognostic biomarker for neuroendocrine tumors, but its manual assessment is labor-intensive, requiring the counting of 500-2,000 cells in hotspots. Digital image analysis could streamline this process, yet few comprehensive comparisons exist between different tools. We compared a non-machine learning (non-ML) tool (ImageScope, Leica Biosystems) with a machine learning (ML) tool (Aiforia Create, Aiforia Technologies) on Ki67-stained slides from 10 low proliferative neuroendocrine tumor cases (Ki67 score < 5%, eight regions per slide). Performance metrics based on the coordinates of detected cells were used to assess the capability of image analysis tools to detect (i) total and (ii) Ki67 positive tumor cells, and consequently calculate the (iii) Ki67 score. Manual scoring by an experienced pathologist was used as the reference standard. The ML compared to the non-ML tool showed better performance metrics (F-score 0.90 vs. 0.74) in detecting the tumor cells. Also, the ML tool had a higher agreement with the reference standard in detecting tumor cells (ICC 0.91 vs. 0.62), Ki67 positive tumor cells (ICC 0.70 vs. 0.24), and the Ki67 score (ICC 0.86 vs. 0.45). Our findings highlight the enhanced accuracy of ML-based image analysis in detecting the correct tumor cells, outperforming traditional methods.

Keywords: Image analysis; Immunohistochemistry; Intra-observer agreement; Ki67; Machine learning; Neuroendocrine tumor (NET).


Conflict of interest statement

Declarations. Competing interests: The authors declare no competing interests.

Figures

Fig. 1
Fig. 1
Tumor cell nuclei detection. (a) One ROI with the reference standard; black and yellow squares respectively mark all and positive tumor cells. (b) Mark-up image resulting from non-machine learning based image analysis with ImageScope; blue and red markings respectively highlight detected Ki67 negative and positive tumor cells. (c) Mark-up image resulting from machine learning based image analysis with Aiforia; highlighted red area is the detected tumor region, red and green circles respectively show detected Ki67 negative and positive tumor cells.
Fig. 2
Fig. 2
Coordinate assignment for detected tumor cells. Red circles show cells detected by the image analysis tool (in this case, Aiforia), black squares show the reference standard. An isolated red circle (green arrow) represents a false positive (FP) tumor cell detection. An isolated black square (yellow arrow) represents a false negative (FN) tumor cell detection. A successful assignment, a true positive (TP) tumor cell detection, is indicated by a black line connecting the respective matching pair of black square and red circle.
Fig. 3
Fig. 3
Evaluating the performance of computational detection of all tumor cells. (a) Scatterplot and fitted regression lines comparing the total number of detected tumor cells between the reference standard (x-axis) and the image analysis tools (y-axis, ImageScope: blue, Aiforia: red). Each dot indicates the tumor cell count in one of the 80 ROIs in the test dataset. The intra-class correlation coefficient (ICC) represents the extent of agreement between the image analysis tools and the reference standard in detecting the total number of tumor cells. The formula of the regression line between the total number of detected tumor cells by each image analysis and the reference standard is shown. This formula provides insights into the linear association between the two measurements. (b) Strip chart comparing a set of performance metrics (false discovery rate (FDR), Precision, Recall, F-score) between the two image analysis tools. Each pair of points are linked by a purple line. P-values represent the result of paired Wilcoxon signed rank tests. The median for each set of data points is drawn as a short black line on the datapoints. (ce) A single region of interest, the scale bar represents 60 μm. (de) Visualizing total tumor cell detection by the reference standard (black squares) and ImageScope (in d, blue circles), and Aiforia (in e, red circles). It is a true positive (TP) detection, for tumor cells, if both the reference standard and the image analysis detection markings are placed on the same cell. A stand-alone black square is a false negative (FN) detection, for tumor cells, and a stand-alone blue (or red) circle is a false positive (FP) detection, for tumor cells.
Fig. 4
Fig. 4
Evaluating the performance of computational detection of Ki67 positive tumor cells. (a) Scatterplot showing the distribution of the detected Ki67 positive tumor cells by the reference standard (black squares), ImageScope (blue circles), and Aiforia (red circles), each set of points (linked by a purple line) shows the result across the 10 cases, where an individual point indicates the sum of Ki67 positive tumor cell counts in the eight ROIs for the respective case. (b) Strip chart comparing a set of performance metrics (false discovery rate (FDR), precision, recall, F-score) between the two image analysis tools. Each pair of points (linked by a purple line) represents the sum of Ki67 positive tumor cell counts for one of the 10 cases with the respective tool (ImageScope: blue, Aiforia: red). P-values represent the results of paired Wilcoxon signed rank tests. The median for each set of data points is drawn as a short black line on the datapoints. (ce) A single region of interest, the scale bar is 60 μm. (de) Visualization of Ki67 positive tumor cell detection by reference standard (black squares), ImageScope (in d, with blue circles), and Aiforia (in e, with red circles). It is a true positive (TP) detection, of a Ki67 positive tumor cell, if both the reference standard and the image analysis detection markings are placed on the same cell. A stand-alone black square is a false negative (FN) detection, for a Ki67 positive tumor cell, and a stand-alone blue (or red) circle is a false positive (FP) detection, for a Ki67 positive tumor cell.
Fig. 5
Fig. 5
Bland-Altman plot showing the agreement of Ki67 scores between the reference standard (RS) and ImageScope (IS) or Aiforia (AI). The black bold line represents the bias line. The dashed lines are limits of agreement. The x axis shows the average of the score measurements. The y axis shows the difference between the measured scores. (a) Agreement between the Ki67 score measured by the reference standard and ImageScope and (b) Aiforia for the 80 data points, representing the 80 ROIs in the test dataset. Aiforia has narrower limits of agreements, and its median line is closer to the zero line.

References

    1. Rindi, G. et al. TNM staging of foregut (neuro)endocrine tumors: A consensus proposal including a grading system. Virchows Archiv: Int. J. Pathol.449, 395–401. 10.1007/s00428-006-0250-1 (2006). - PMC - PubMed
    1. McCall, C. M. et al. Grading of well-differentiated pancreatic neuroendocrine tumors is improved by the inclusion of both Ki67 proliferative index and mitotic rate. Am. J. Surg. Pathol.37, 1671–1677. 10.1097/pas.0000000000000089 (2013). - PMC - PubMed
    1. Khan, M. S. et al. A comparison of Ki-67 and mitotic count as prognostic markers for metastatic pancreatic and midgut neuroendocrine neoplasms. Br. J. Cancer. 108, 1838–1845. 10.1038/bjc.2013.156 (2013). - PMC - PubMed
    1. Christgen, M., von Ahsen, S., Christgen, H., Länger, F. & Kreipe, H. The region-of-interest size impacts on Ki67 quantification by computer-assisted image analysis in breast cancer. Hum. Pathol.46, 1341–1349. 10.1016/j.humpath.2015.05.016 (2015). - PubMed
    1. Rindi, G. et al. A common classification framework for neuroendocrine neoplasms: an international agency for research on cancer (IARC) and world health organization (WHO) expert consensus proposal. Mod. Pathology: Offi. J. United States Can. Acad. Pathol. Inc31, 1770–1786. 10.1038/s41379-018-0110-y (2018). - PMC - PubMed

Publication types

MeSH terms

LinkOut - more resources