

A convolutional neural network-based deep learning approach for predicting surface chloride concentration of concrete in marine tidal zones
- PMID: 40730630
- PMCID: PMC12307714
- DOI: 10.1038/s41598-025-12035-1
A convolutional neural network-based deep learning approach for predicting surface chloride concentration of concrete in marine tidal zones
Abstract
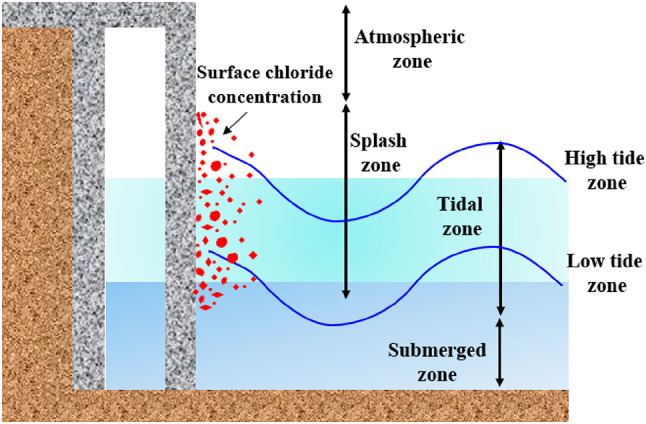
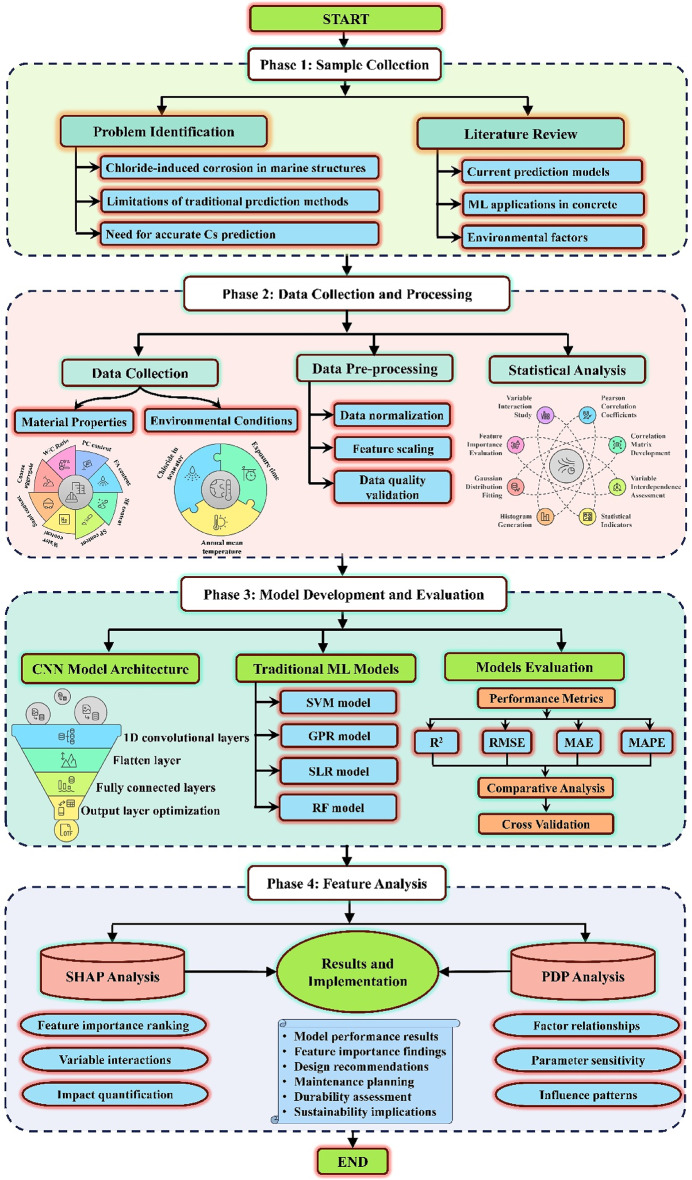
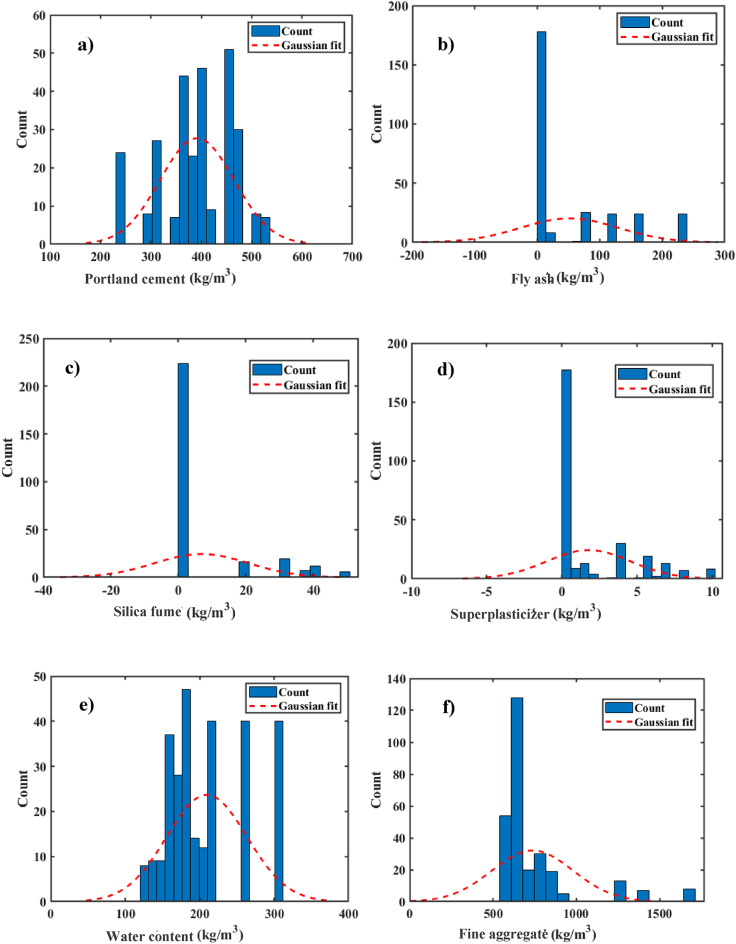
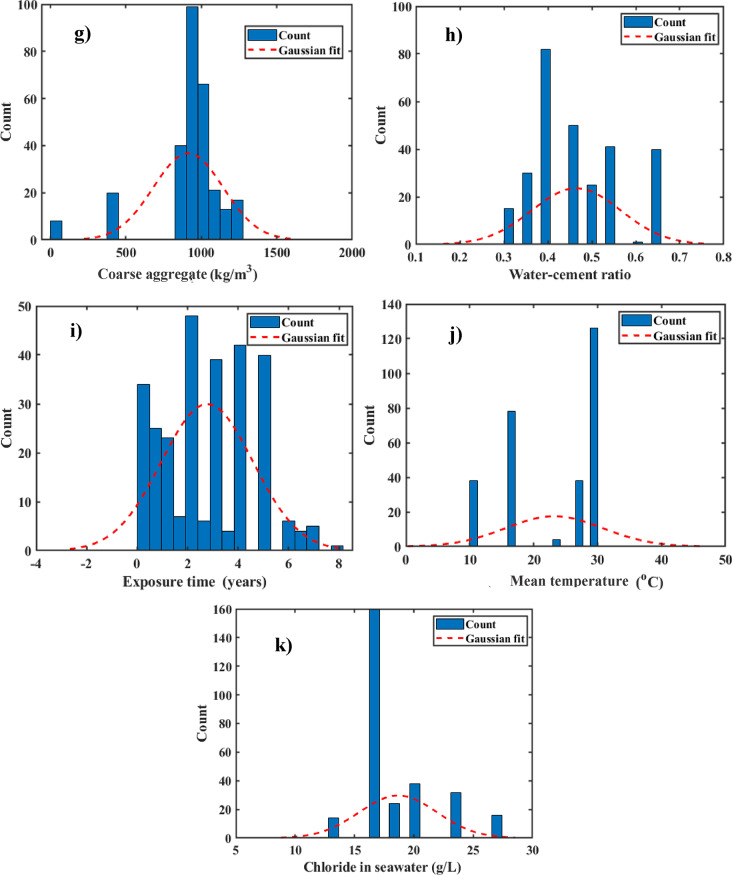
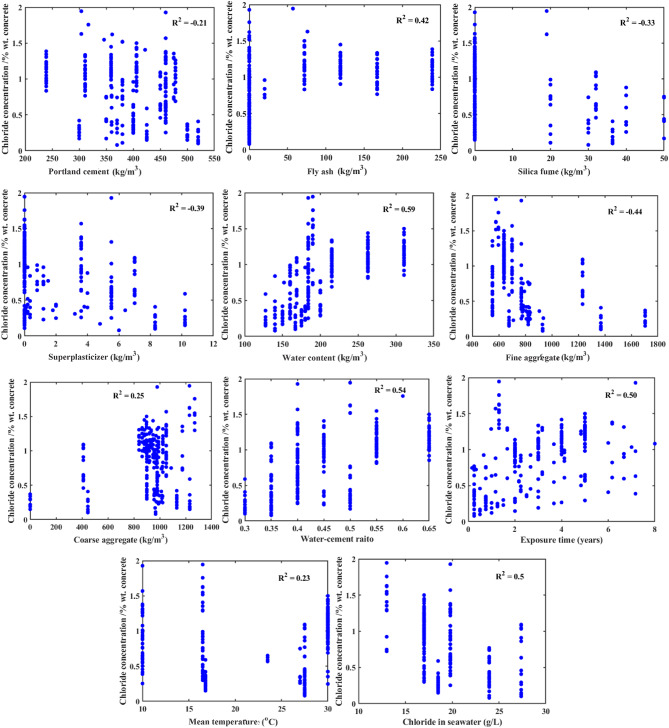
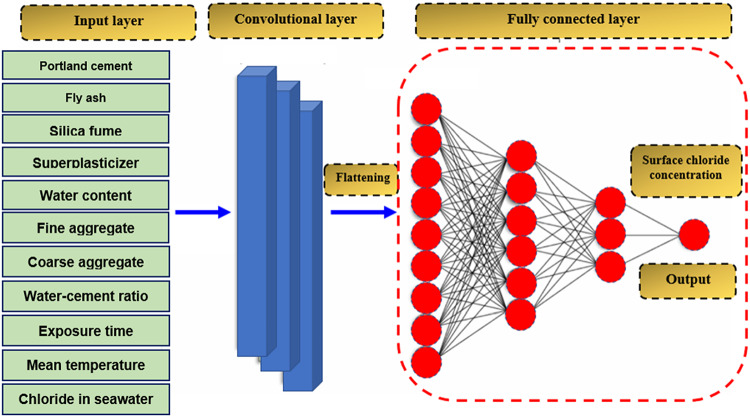
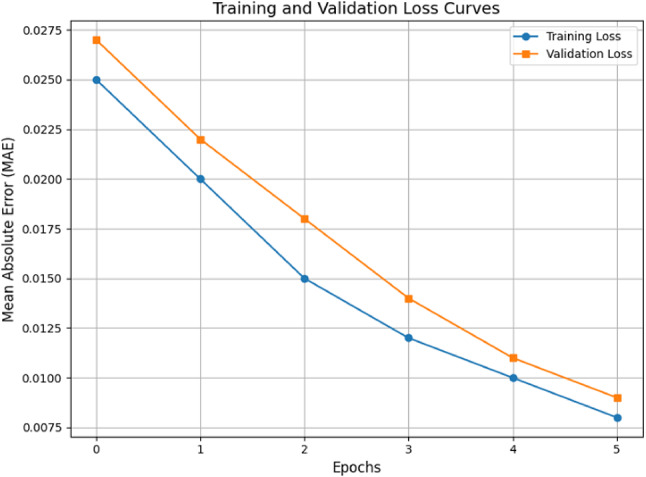
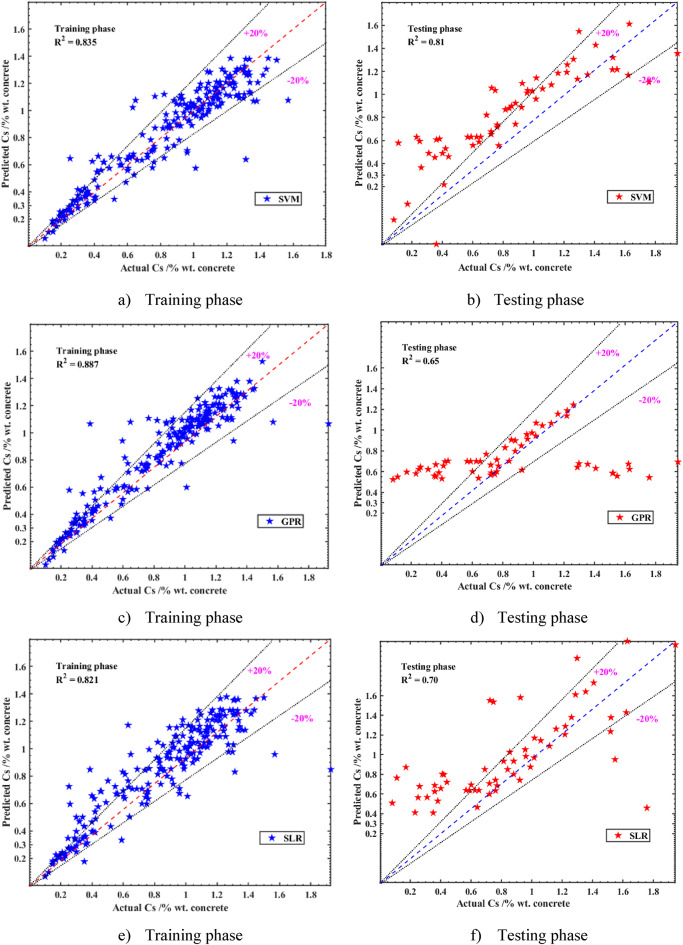
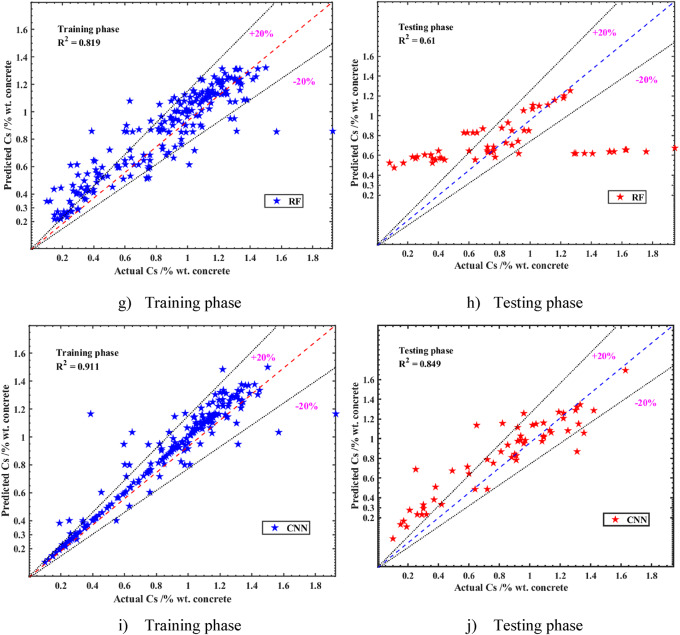
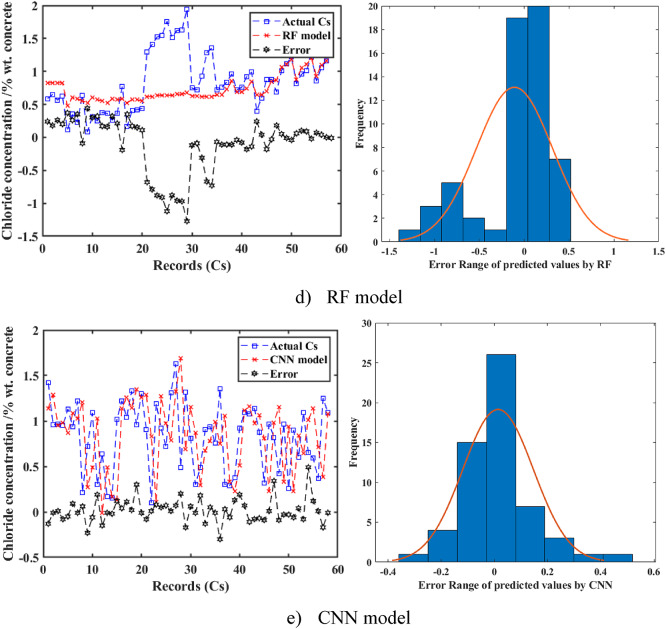
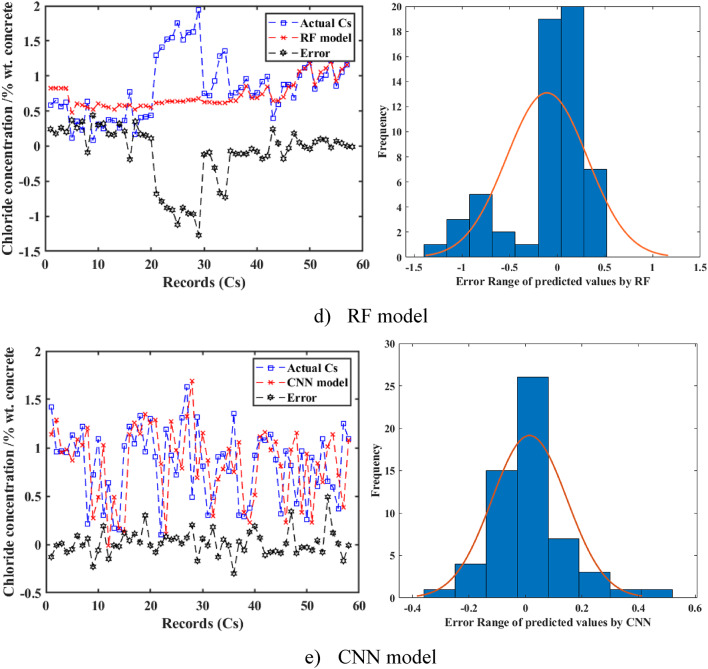
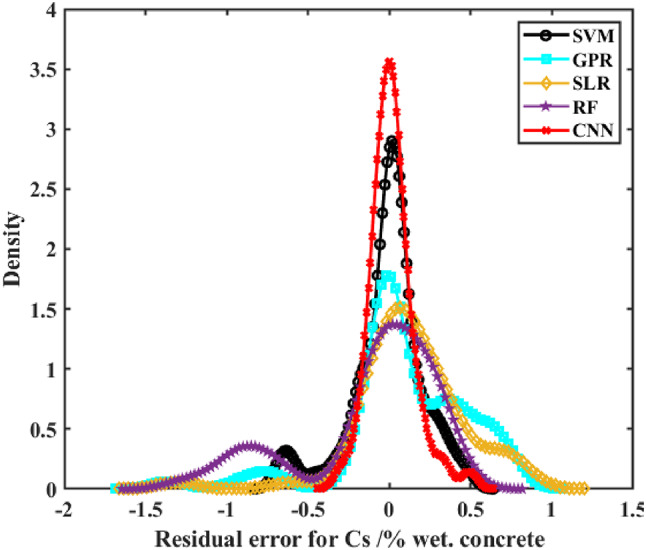
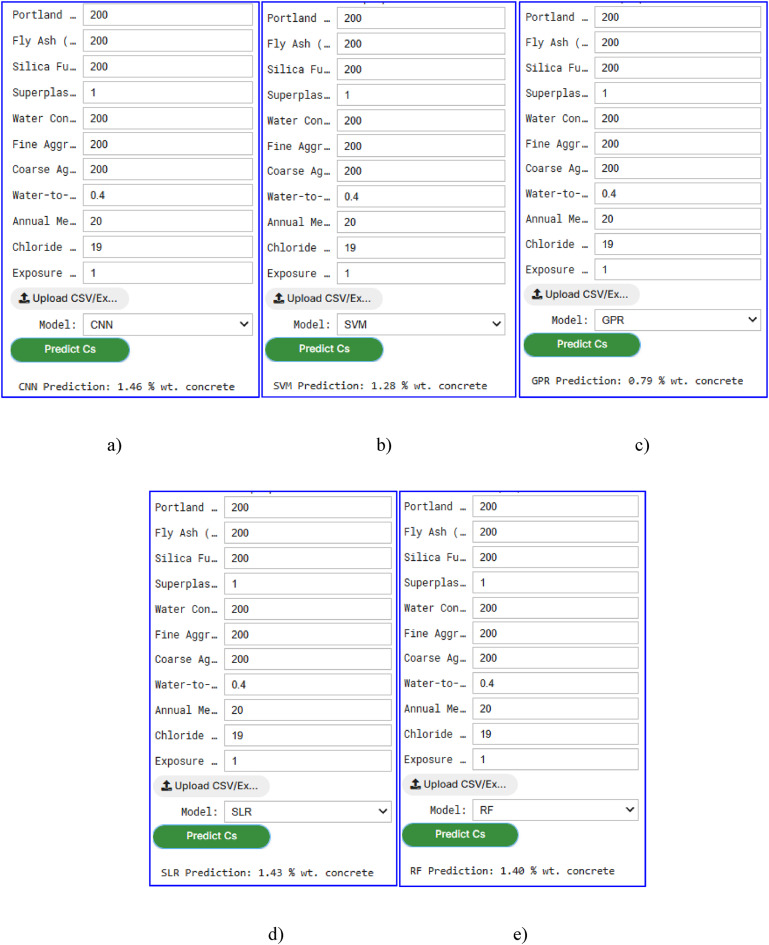
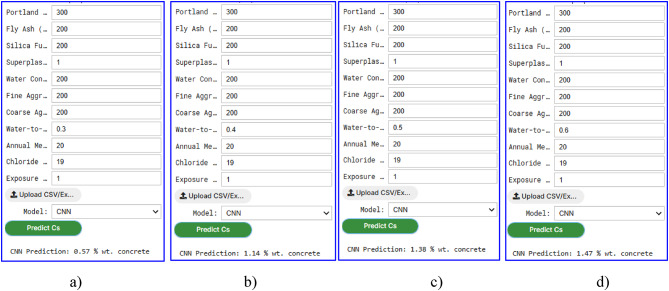
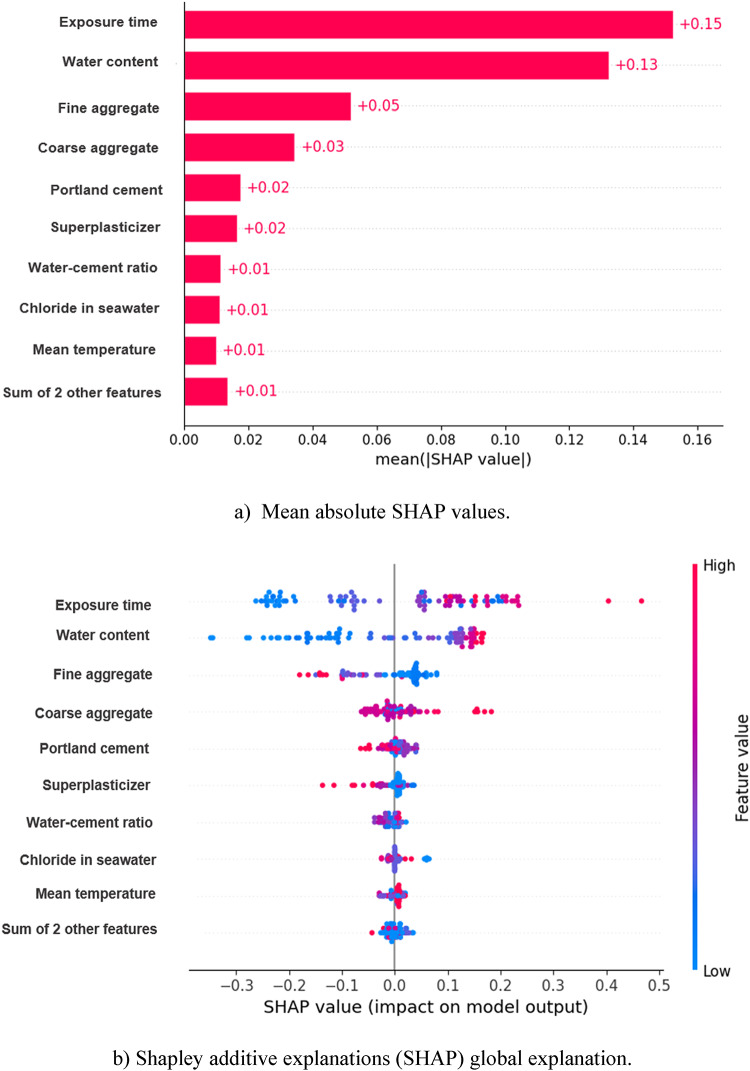
Chloride-induced corrosion is a major threat to the durability of reinforced concrete (RC) structures. This is especially critical in marine tidal zones, where surface chloride concentration (Cs) plays a key role in predicting chloride ingress using Fick's second law. However, traditional assessment methods are time-consuming and impractical, necessitating advanced predictive models. This study developed a deep learning-based framework utilizing a convolutional neural network (CNN) trained on 284 samples with 11 critical features related to material composition and environmental conditions. The CNN's performance was benchmarked against four machine learning (ML) models: stepwise linear regression (SLR), support vector machine (SVM), Gaussian process regression (GPR), and random forest (RF). Results demonstrated CNN's superiority, achieving a coefficient of determination (R2) = 0.849 and a lower root mean square error (RMSE) = 0.18%, outperforming conventional models. Shapley additive explanation (SHAP) analysis revealed exposure time, water content, and fine aggregate as the most critical factors influencing Cs predictions. The findings highlighted the importance of material composition and environmental exposure in optimizing concrete mix designs to mitigate chloride ingress in tidal zones. This research can enhance durability assessment, proactive maintenance strategies, and service life estimation of RC structures in harsh marine environments. Furthermore, it can contribute to the sustainable development goals (SDGs) by promoting resilient infrastructure, sustainable construction practices, and improved climate adaptation strategies. By integrating deep learning in durability assessments, this study can provide a scalable, efficient solution for optimizing maintenance planning and reducing premature failures in coastal RC structures, ultimately extending their service life.
Keywords: Convolutional neural network; Deep learning; Gaussian process regression; Surface chloride concentration; Sustainable development goals; Tidal zones.
© 2025. The Author(s).
Conflict of interest statement
Declarations. Competing interests: The authors declare no competing interests. Ethical approval: The manuscript has not been submitted to any other journal. The proposed work is original and has not been published anywhere else. Consent to participate: The authors declare that they have the consent to participate in this paper. Consent for publication: The authors declare that they have consent to publish in this journal.
Figures
Similar articles
-
Data-driven framework for prediction of mechanical properties of waste glass aggregates concrete.Sci Rep. 2025 Jul 1;15(1):20902. doi: 10.1038/s41598-025-05229-0. Sci Rep. 2025. PMID: 40594120 Free PMC article.
-
Introducing the dataset for measuring centrality for sustainability-A case study of Pecinci municipality, Serbia.Data Brief. 2025 May 27;61:111714. doi: 10.1016/j.dib.2025.111714. eCollection 2025 Aug. Data Brief. 2025. PMID: 40534919 Free PMC article.
-
Development and Validation of a Convolutional Neural Network Model to Predict a Pathologic Fracture in the Proximal Femur Using Abdomen and Pelvis CT Images of Patients With Advanced Cancer.Clin Orthop Relat Res. 2023 Nov 1;481(11):2247-2256. doi: 10.1097/CORR.0000000000002771. Epub 2023 Aug 23. Clin Orthop Relat Res. 2023. PMID: 37615504 Free PMC article.
-
Management of urinary stones by experts in stone disease (ESD 2025).Arch Ital Urol Androl. 2025 Jun 30;97(2):14085. doi: 10.4081/aiua.2025.14085. Epub 2025 Jun 30. Arch Ital Urol Androl. 2025. PMID: 40583613 Review.
-
Approaches for predicting dairy cattle methane emissions: from traditional methods to machine learning.J Anim Sci. 2024 Jan 3;102:skae219. doi: 10.1093/jas/skae219. J Anim Sci. 2024. PMID: 39123286 Free PMC article.
References
-
- Cai, R. et al. Prediction of surface chloride concentration of marine concrete using ensemble machine learning. Cem. Concr Res.136, 106164 (2020).
-
- Ma, X. R., Liang, X., Wang, S. & Chen, S. Z. Language model enhanced surface chloride concentration determination for concrete within Splash environment based on limited field records. Case Stud. Constr. Mater.20, e03157 (2024).
-
- Meira, G. R., Andrade, M. C., Padaratz, I. J., Alonso, M. C. & Borba, J. C. Measurements and modelling of marine salt transportation and deposition in a tropical region in Brazil. Atmos. Environ.40, 5596–5607 (2006).
-
- Apostolopoulos, C. A., Demis, S. & Papadakis, V. G. Chloride-induced corrosion of steel reinforcement - Mechanical performance and pit depth analysis. Constr. Build. Mater.38, 139–146 (2013).
-
- Bansal, T., Talakokula, V. & Saravanan, T. J. EMI-based monitoring of prestressed concrete beam under chloride-induced corrosion using an embedded piezo sensor. Measurement: Sens.33, 101158 (2024).
LinkOut - more resources
Full Text Sources
