. 2025 Jul 29;15(1):27734.
doi: 10.1038/s41598-025-10907-0.

A data-driven analysis of lumbar steroid injection satisfaction in patients with chronic low back pain

Affiliations

A data-driven analysis of lumbar steroid injection satisfaction in patients with chronic low back pain

Maria Monzon et al. Sci Rep. .

Abstract

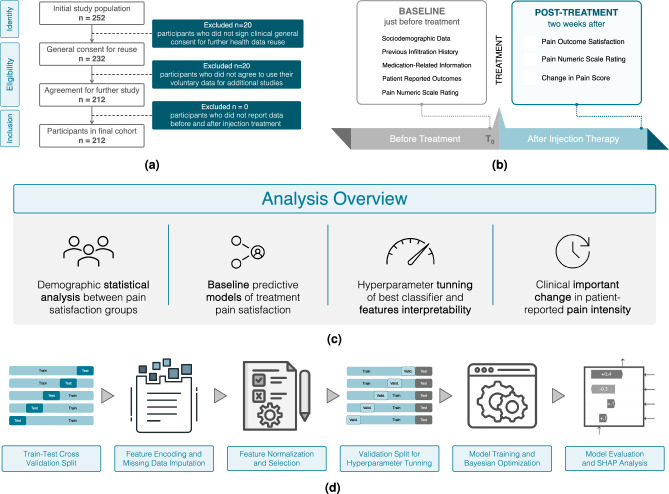
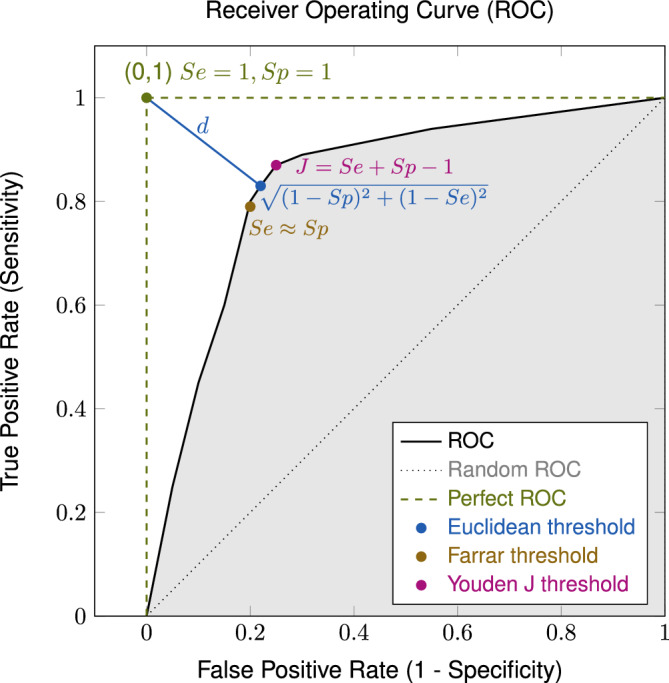
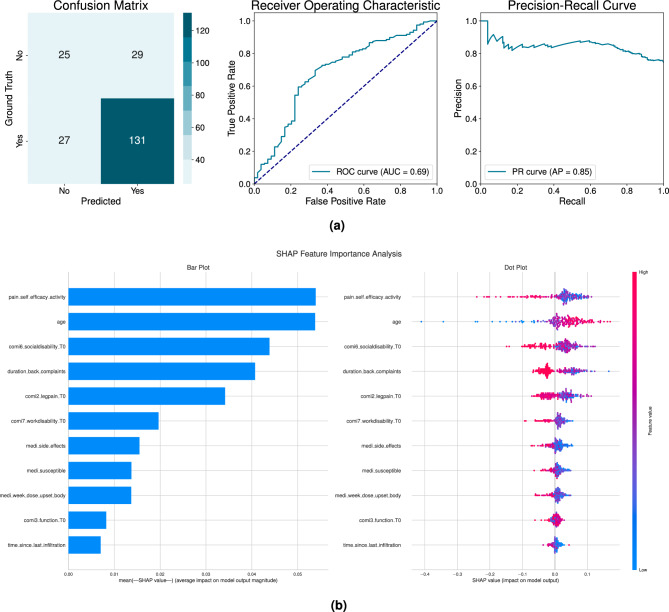
Chronic low back pain (CLBP) is a prevalent condition significantly reducing quality of life. Lumbar steroid injections are a widely used conservative treatment option, but their effectiveness varies among patients. This study aimed to develop a predictive framework that integrates clinical variables and patient demographics to evaluate post-treatment pain satisfaction in CLBP patients undergoing lumbar injection therapy. We performed a retrospective analysis of 212 CLBP patients to evaluate the treatment satisfaction and pain intensity changes using the Numerical Rating Scale (NRS). A Random Forest model, validated through nested cross-validation, achieved an average precision of 0.865 in predicting treatment satisfaction. SHapley Additive exPlanations (SHAP) analysis revealed pain self-efficacy features, particularly coping mechanisms and household activities, as key outcome predictors of post-treatment pain satisfaction. Clinically significant pain reduction thresholds were identified at an absolute change of 2.09 and a relative change of 30 % on the NRS. Our findings reveal the biological and social factors influencing post-treatment pain in CLBP patients. The identified pain reduction thresholds and predictors may help clinicians to develop individualized management strategies, optimizing treatment outcomes and improving patient care. Future research should refine the predictive model by incorporating additional multimodal variables to better capture CLBP heterogeneity.


Conflict of interest statement

Declarations. Competing interests: C.R.J. serves as a scientific consultant to Abbvie and Mitsubishi Takeda; however, this role had no influence on the design, conduct, or reporting of this study. All other authors declare no conflict of interest.

Figures

Fig. 1
Fig. 1
Study design for predicting patient satisfaction with lumbar steroid injection therapy. (a) Retrospective cohort selection: the flowchart illustrates the inclusion procedure of participants for the retrospective cohort analysis. (b) Data collection timeline for evaluating lumbar steroid injection outcomes in chronic low back pain patients, including baseline assessments (T0) and two-week post-treatment follow-up (T1). (c) Statistical analysis framework comprising demographic variable analysis and machine learning baseline predictive modeling, classifier optimization incorporating feature selection, model hyperparameter tuning and feature importance (SHAP) analysis, and ROC curve analyses for clinical significance of minimal change in reported pain metrics. (d) Predictive model development: the process starts with nested cross validation, splitting data for model evaluation and hyperparameter tuning. Data preprocessing includes managing missing values, encoding categorical variables, and scaling features. Feature engineering includes feature normalization and selection, where the most informative ones are chosen based on statistical tests. Model tuning in the inner loop optimizes the best baseline classifier hyperparameters. The model’s performance is assessed with metrics such as AUC, F1-score, and Average Precision. Finally, SHAP analysis interprets predictions and identifies key features influencing patient satisfaction.
Fig. 2
Fig. 2
The receiver operating characteristic (ROC) curve provides an assessment of the predictor’s efficacy by plotting true positive rate or sensitivity (Se) against false positive rate, or 1-specificity across multiple binarization thresholds. The ideal ROC curve (dashed green), indicative the ideal classification, and the diagonal (dotted gray) representing random prediction are included for comparative purposes. The highlighted (gray) area under the curve (AUC) serves as a summary statistic for overall classifier performance. The methods employed for determining a threshold that optimally equilibrates sensitivity and specificity comprise: the Euclidean Distance approach (blue), involving the minimization of distance (d) to the ideal threshold at left corner (0, 1); Youden’s Index, which focuses on maximizing the disparity between the Se+Sp-1, finding the point furthest from the diagonal ROC; the Farrar Method (bronze), where the Sp equals Se, representing a balance between false positives and the complementary of false negatives.
Fig. 3
Fig. 3
The boxplots illustrate the distribution of each metric across cross-validation folds for each classifier model, facilitating a performance comparison of baseline classifiers utilizing various metrics: Area Under the ROC Curve (AUC), F1-score, Matthews Correlation Coefficient (MCC), Average Precision (AP), Accuracy, and Cohen’s Kappa. The classifiers included K-Nearest Neighbors (KNN), Random Forest (RF), Extra Trees (ET), Gradient Boosting Classifier (GBC), XGBoost, Ridge Classifier (RC), Linear Discriminant Analysis (LDA), LightGBM, Logistic Regression (LR), Decision Tree (DT), Support Vector Machine (SVM), AdaBoost, Naive Bayes (NB), and Quadratic Discriminant Analysis (QDA). RF achieved the highest mean Average Precision (AP) of 0.879±0.012 and an Area Under the Curve (AUC) of 0.702±0.020. RF also exhibited strong classification accuracy, with a mean of 0.729±0.022 and an F1-score of 0.827±0.014. In contrast, K-Nearest Neighbors (KNN) achieved the highest Cohen’s Kappa value of 0.228±0.065 and the highest Matthews Correlation Coefficient (MCC) value of 0.239±0.068.
Fig. 4
Fig. 4
(a) Classification results of the optimized random forest (RF) model for patient reported pain level satisfaction two weeks after lumbar steroid injection treatment (left) the confusion matrix shows the true and false positives and negatives classification (middle) receiver operating curve (ROC) curve (right) precision-recall curve illustrating he relationship between precision and recall across classification thresholds. (b) shap feature importance analysis plots: bar plot (left) illustrate the average relative significance and dot plots (right) reveals how each feature affects outcomes, where red dots indicate higher values and blue dots show lower values. The bar plot underscores the influence of pain self-efficacy activity, age and disability as well as pain temporal variables in the model outcome.
Fig. 5
Fig. 5
ROC curve analysis for absolute pain level (ΔPain) and relative (ΔrPain) change in reported maximum pain between baseline and 2-weeks after treatment. The figure illustrates the best thresholds of both changes in pain scores that can be used in distinguishing between satisfied and dissatisfied patients following lumbar steroid injection therapy.

References

    1. Ferreira, M. L. et al. Global, regional, and national burden of low back pain, 1990–2020, its attributable risk factors, and projections to 2050: A systematic analysis of the global burden of disease study 2021. Lancet Rheumatol.5, e316–e329. 10.1016/S2665-9913(23)00098-X (2023). - PMC - PubMed
    1. Manchikanti, L. Epidemiology of low back pain. Pain Phys.3, 167–192 (2000). - PubMed
    1. Meucci, R. D., Fassa, A. G. & Faria, N. M. X. Prevalence of chronic low back pain: Systematic review. Rev. Saude Publ.49 (2015). - PMC - PubMed
    1. Eloy, O., Patricia, B.-M. L., Gustavo, R.-C. D. & Rafael, G.-A. Effectiveness of three treatment strategies on quality of life for patients with chronic low back pain: A multidisciplinary approach as key to success. J. Musculoskelet. Disord. Treat. (2019).
    1. Freburger, J. K. et al. The rising prevalence of chronic low back pain. Arch. Intern. Med.169, 251–258 (2009). - PMC - PubMed

LinkOut - more resources