

An artificial intelligence model to predict mortality among hemodialysis patients: A retrospective validated cohort study
- PMID: 40730809
- PMCID: PMC12307615
- DOI: 10.1038/s41598-025-06576-8
An artificial intelligence model to predict mortality among hemodialysis patients: A retrospective validated cohort study
Abstract
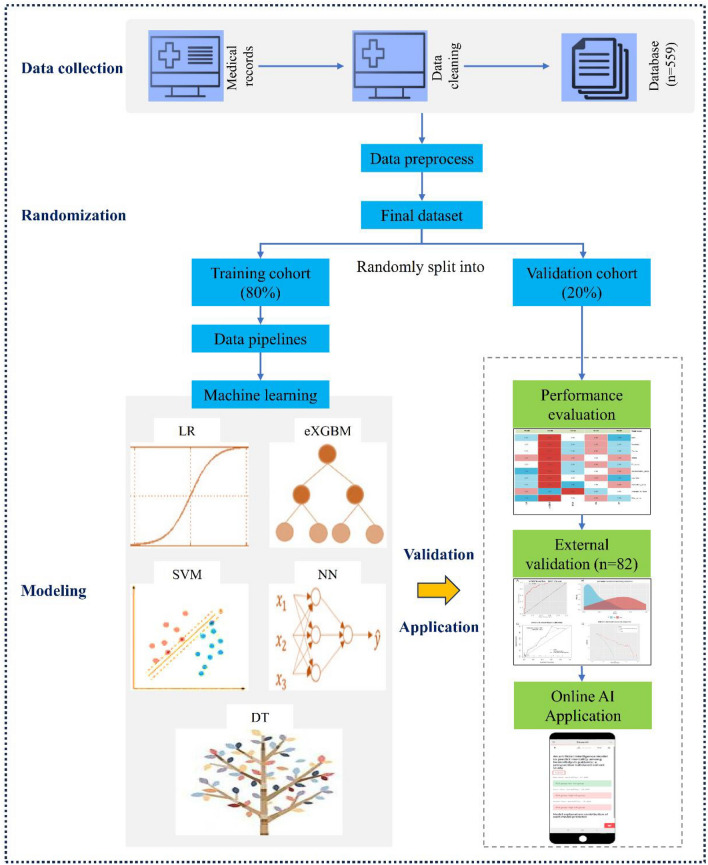
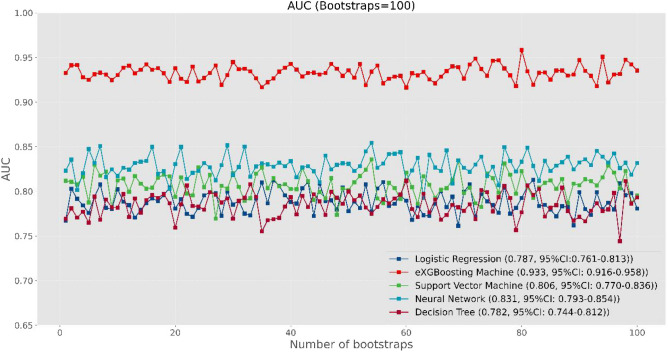
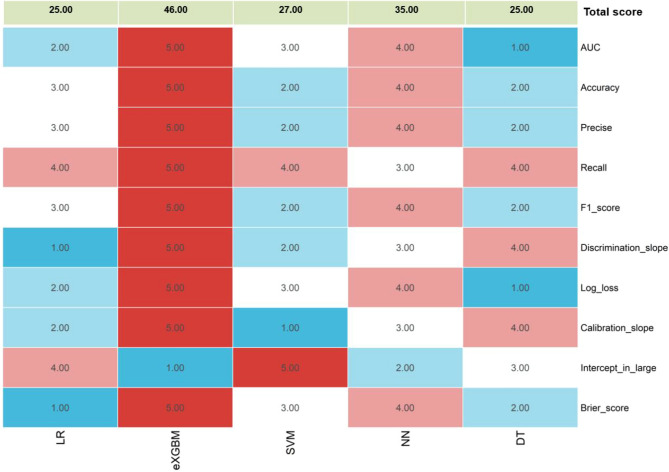
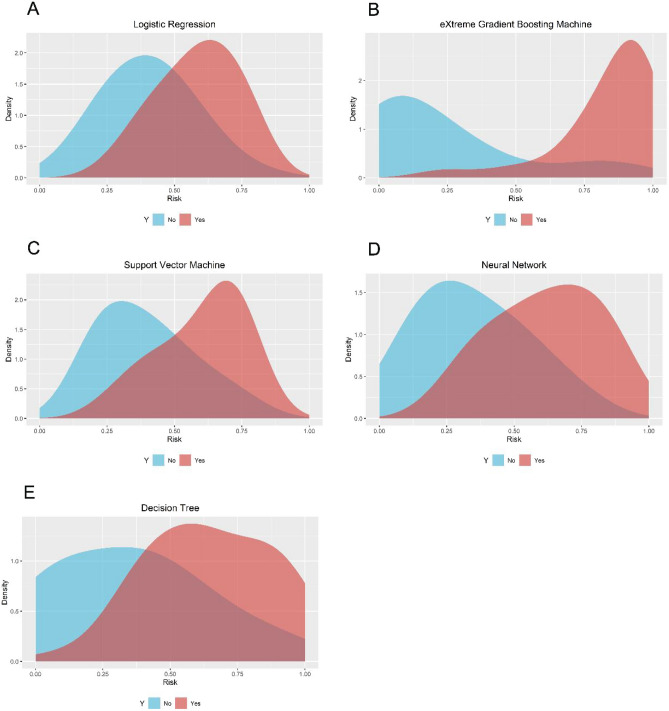
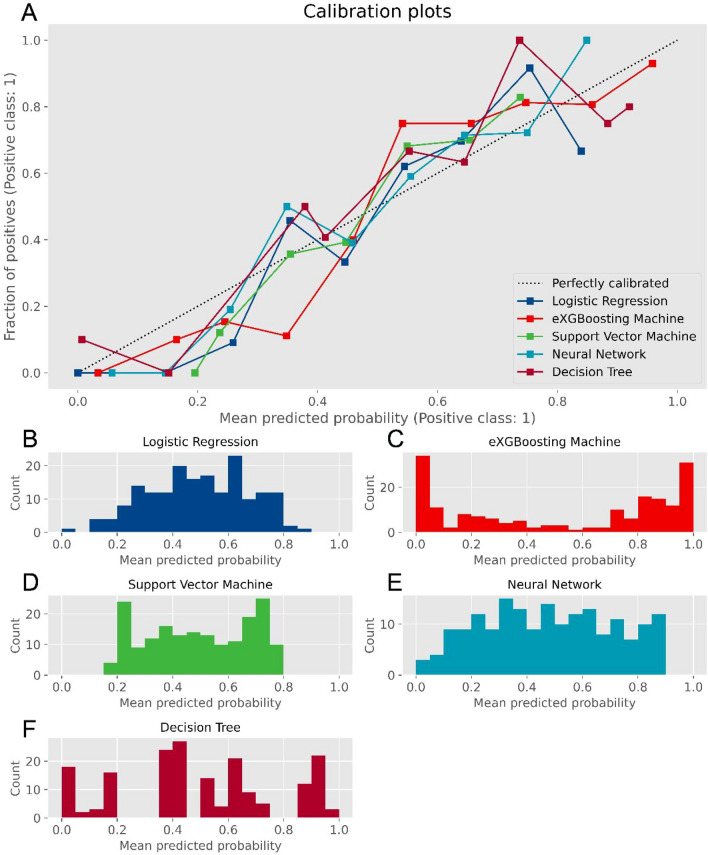
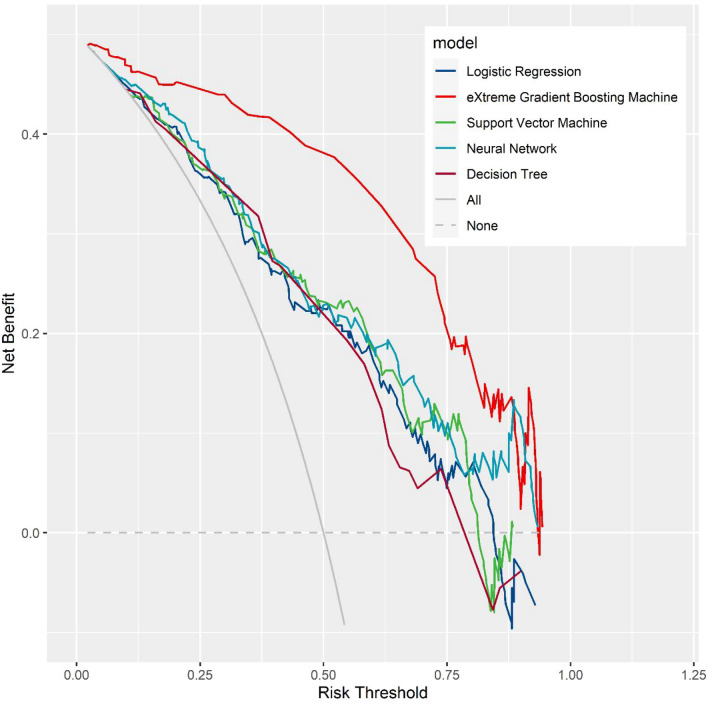
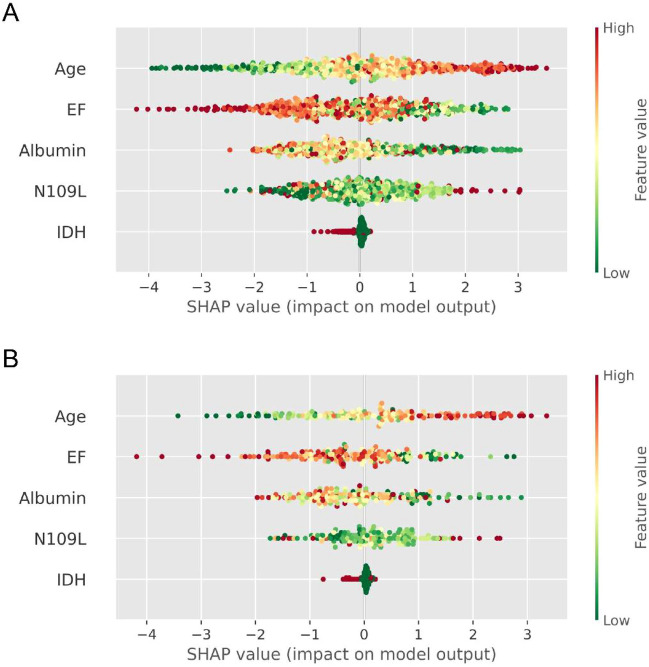
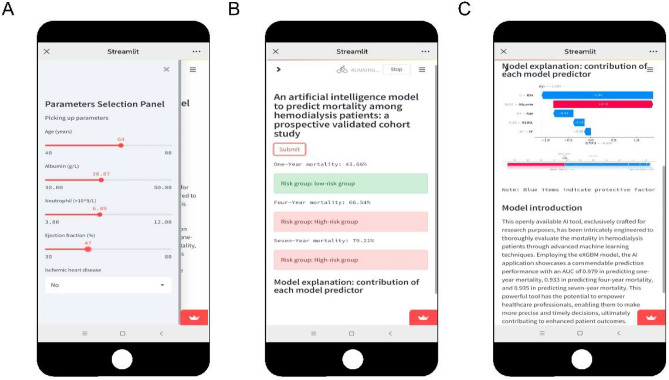
Hemodialysis stands as the most prevalent renal replacement therapy globally. Accurately identifying mortality among hemodialysis patients is paramount importance, as it enables the formulation of tailored interventions and facilitates timely management. The objective of the study was to establish and validate an artificial intelligence (AI) model to predict mortality among hemodialysis patients. The data of 559 patients with hemodialysis at a large tertiary hospital were retrospectively analyzed, and those of 82 patients were extracted from another tertiary hospital. The patients from the large tertiary hospital constituted the model development cohort, and the patients from another tertiary hospital constituted the external validation cohort. The patients in the model development cohort were randomly divided into a training cohort and an internal validation cohort at a ratio of 8:2. The machine learning algorithms used to develop the models for the training group included logistic regression (LR), decision tree (DT), extreme gradient boosting machine (eXGBM), neural network (NN), and support vector machine (SVM). The predictive performances of all the models were evaluated using discrimination and calibration. In addition, a comprehensive scoring system to evaluate the prediction performance of the model was also used, the scoring system had the scores ranging from 0 to 50. The optimal model had the highest total score for the internal and external validation, and was further deployed as an AI application using Streamlit. The rates of mortality at one year, four years, and seven years in the model development group were determined to be 2.68%, 15.38%, and 33.09%, respectively. The model, which predicted mortality at these time points, achieved impressive area under the curve (AUC) values of 0.979 (95% CI: 0.959-0.998), 0.933 (95% CI: 0.916-0.958), and 0.935 (95% CI: 0.895-0.976), respectively, using the eXGBM model. The corresponding accuracies were 0.931, 0.889, and 0.931, with precision values of 0.891, 0.857, and 0.891, and brier scores of 0.051, 0.096, and 0.051, respectively. Notably, the eXGBM model outperformed other models with a score of 46 in the comprehensive scoring system, followed by the NN model with a score of 35. External validation further confirmed the robust predictive performance of the eXGBM model, with an AUC value of 0.892 (95% CI: 0.840-0.945). The eXGBM model emerged as the most reliable predictor of mortality among hemodialysis patients in this study. This model has been made available online at https://mortality-among-hemodialysis-bpypyb4dxvq4hja29kwsev.streamlit.app/ . Users can simply access the link, input relevant features, and receive predictions on mortality risk. Furthermore, the AI model provides insights into how the predictions were generated and offers personalized recommendations for intervention strategies. This study has successfully developed and validated an AI application for assessing mortality risk in hemodialysis patients. This tool empowers healthcare professionals to promptly identify individuals at high risk of mortality, thereby aiding in clinical decision-making and intervention planning. For patients at high risk of early death, caution is advised when considering kidney transplant surgery. Conversely, for those with a high probability of extended survival, kidney transplant surgery may present a favorable treatment option.
Keywords: External validation; Hemodialysis; Machine learning; Mortality; Prediction models.
© 2025. The Author(s).
Conflict of interest statement
Declarations. Competing interests: The authors declare no competing interests.
Figures
Similar articles
-
Comparison of Two Modern Survival Prediction Tools, SORG-MLA and METSSS, in Patients With Symptomatic Long-bone Metastases Who Underwent Local Treatment With Surgery Followed by Radiotherapy and With Radiotherapy Alone.Clin Orthop Relat Res. 2024 Dec 1;482(12):2193-2208. doi: 10.1097/CORR.0000000000003185. Epub 2024 Jul 23. Clin Orthop Relat Res. 2024. PMID: 39051924
-
Artificial Intelligence-Based prediction model for surgical site infection in metastatic spinal disease: a multicenter development and validation study.Int J Surg. 2025 Jun 27. doi: 10.1097/JS9.0000000000002806. Online ahead of print. Int J Surg. 2025. PMID: 40576176
-
Are Current Survival Prediction Tools Useful When Treating Subsequent Skeletal-related Events From Bone Metastases?Clin Orthop Relat Res. 2024 Sep 1;482(9):1710-1721. doi: 10.1097/CORR.0000000000003030. Epub 2024 Mar 22. Clin Orthop Relat Res. 2024. PMID: 38517402
-
The effectiveness and cost-effectiveness of carmustine implants and temozolomide for the treatment of newly diagnosed high-grade glioma: a systematic review and economic evaluation.Health Technol Assess. 2007 Nov;11(45):iii-iv, ix-221. doi: 10.3310/hta11450. Health Technol Assess. 2007. PMID: 17999840
-
Signs and symptoms to determine if a patient presenting in primary care or hospital outpatient settings has COVID-19.Cochrane Database Syst Rev. 2022 May 20;5(5):CD013665. doi: 10.1002/14651858.CD013665.pub3. Cochrane Database Syst Rev. 2022. PMID: 35593186 Free PMC article.
References
-
- Bello, A. K. et al. Status of care for end stage kidney disease in countries and regions worldwide: International cross sectional survey. BMJ367, l5873 (2019). - PubMed
-
- Goodkin, D. A. et al. Association of comorbid conditions and mortality in hemodialysis patients in Europe, Japan, and the United States: The Dialysis Outcomes and Practice Patterns Study (DOPPS). J. Am. Soc. Nephrol.14(12), 3270–3277 (2003). - PubMed
MeSH terms
Grants and funding
LinkOut - more resources
Full Text Sources
Medical
