. 2025 Jul 29;16(1):6960.
doi: 10.1038/s41467-025-62229-4.

Single urinary extracellular vesicle proteomics identifies complement receptor CD35 as a biomarker for sepsis-associated acute kidney injury

Affiliations

Single urinary extracellular vesicle proteomics identifies complement receptor CD35 as a biomarker for sepsis-associated acute kidney injury

Ning Li et al. Nat Commun. .

Abstract

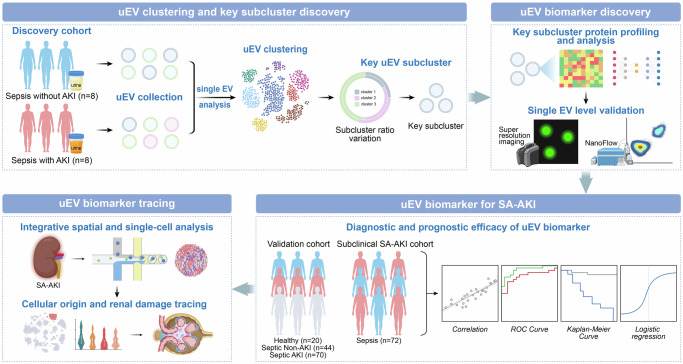
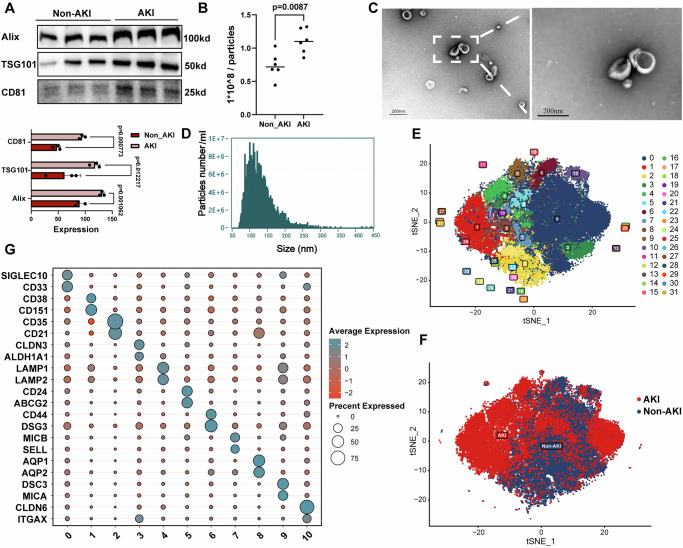
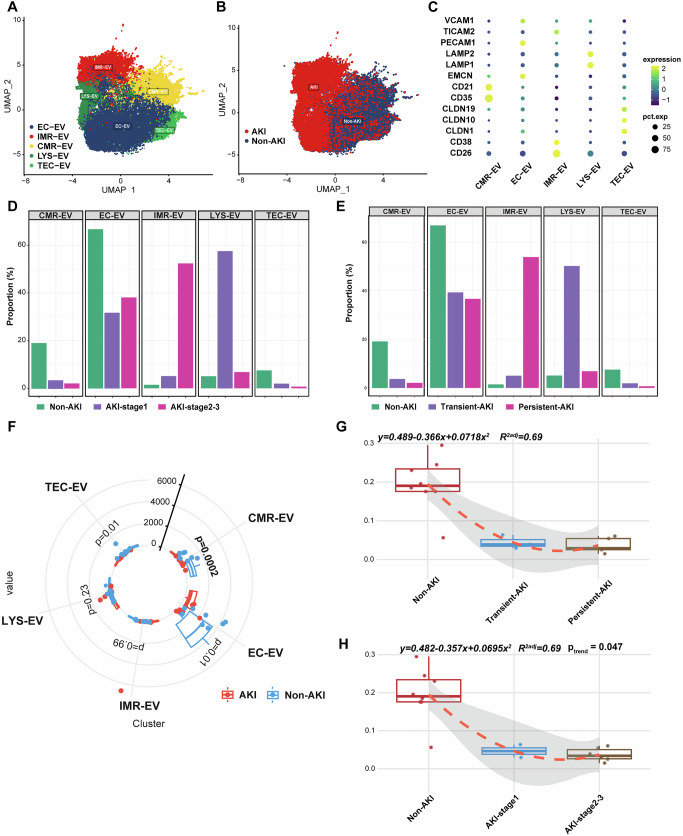
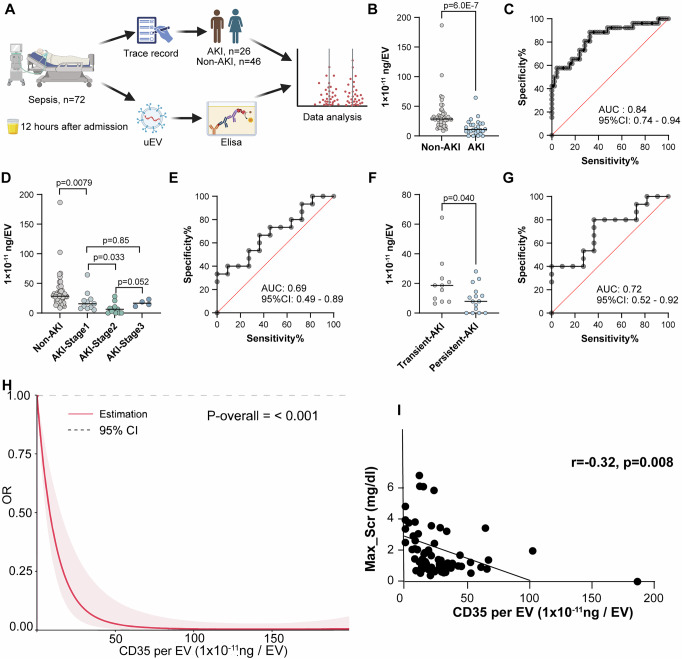
Sepsis-associated acute kidney injury (SA-AKI) portends severe health burden due to significant morbidity and mortality, while early diagnosis remains challenging. In this study, proximity-dependent barcoding assay (PBA) is established to profile the surface proteome of single urinary extracellular vesicle (uEV). Principle uEV clusters with unique function and origination are profiled in SA-AKI in a screening cohort. Complement receptor CD35 on single uEV (CD35-uEV) displays high diagnostic accuracy for SA-AKI (AUC-ROC 0.89 in validation cohort, n = 134). Besides, CD35-uEV enables identification of subclinical AKI (AUC-ROC 0.84 in prospective cohort, n = 72). Moreover, CD35-uEV correlates closely with AKI severity which also predicts persistent AKI (AUC-ROC 0.77), mortality risks (AUC-ROC 0.70) and progression to AKD (AUC-ROC 0.66). Multi-omics profiling reveals that CD35-uEV are predominantly released from injured podocytes exhibiting diminished CD35 expression. Overall, this study identifies a single uEV biomarker related to injured podocyte for early diagnosis and risk stratification of SA-AKI.


Conflict of interest statement

Competing interests: The authors declare no competing interests.

Figures

Fig. 1
Fig. 1. Study design and patients.
To explore urinary biomarkers for sepsis-associated AKI (SA-AKI) at the single uEV level, surface proteome was detected by using proximity barcoding assay (PBA) assay in the screening cohort (SA-AKI and non-AKI sepsis patients, n = 8 for each group). Next, the main differential uEV subpopulations in SA-AKI compared to non-AKI was characterized. Protein biomarker on single uEV was then identified and validated in two independent cohorts: a SA-AKI cohort (n = 134) and a subclinical E-AKI cohort (n = 72). By integrating single-cell RNA sequencing and spatial transcriptomics, the cellular origin and its capacity to reflect renal cellular injury of the biomarker was explored. Finally, diagnostic performance was evaluated through combination of the useful biomarker with the well-established biomarker TIMP2*IGFBP7. (Image was Created in BioRender. Tang, T. (2025) https://BioRender.com/su096gu).
Fig. 2
Fig. 2. Profiling and characterization of urinary extracellular vesicles (uEVs) in sepsis patients with and without AKI.
A Western blot analysis confirming the presence of uEV markers Alix, TSG101, and CD81 (Non_AKI, n = 3, AKI, n = 3). uEVs samples purified from equal volume of 24-h urine were loaded. Data are presented as mean with SD (Paired two-tailed t-test); B uEV particle counts in the non-AKI and AKI groups of sepsis patients detected by SBI EV quantitation kit (Non_AKI, n = 6, AKI, n = 6, paired two-tailed t-test); Morphology and size characterization of uEV from AKI patients were characterized with transmission electron microscopy (TEM) (C) and nanoparticle tracking analysis (NTA) (D), the experiment was repeated three times; E Dimensionality reduction clustering analysis identifying 32 distinct uEV subclusters; F Distribution patterns of the 32 uEV subclusters in SA-AKI and non-AKI groups; G Protein characterization of the top two proteins for the main uEV subclusters, highlighting their unique protein signature. Source data are provided as a Source Data file.
Fig. 3
Fig. 3. Complement receptor-related uEV (CMR-EV) subcluster exhibit diagnostic potential for sepsis-associated AKI.
A UMAP plot distribution of the 5 uEV subclusters with the most significant proportional differences (endothelial cell derived EV: EC-EV, Tubular epithelial-derived EV: TEC-EV, Complement receptor related EV: CMR-EV, Lysosome related EV: LYS-EV, immune response related EVs: IMR-EV); B UMAP plot distribution of these 5 subclusters between AKI and non-AKI groups; C Key characteristic proteins of the 5 uEV subclusters; D Proportional distribution patterns of the 5 uEV subclusters across AKI stage (stage 1 vs. stages 2-3) were resolved through sample-specific proportional weighting normalization; E Proportional distribution of the 5 uEV subclusters in transient and persistent AKI; F Radar chart highlighting CMR-uEV as the most significantly different cluster between SA-AKI and non-AKI groups (Mann–Whitney U two-sided test, SA-AKI, n = 8, Non-AKI, n = 8); G, H Second polynomial distribution revealed significant trends (ptrend = 0.047) in the proportional distribution of CMR-uEV in SA-AKI patients with different duration (G) (Non-AKI, n = 8; Transient-AKI, n = 3, Persistent-AKI, n = 5) and stages (H) (Non-AKI, n = 8; AKI-stage1, n = 2, AKI-stage2-3, n = 6). Data are presented as box plots showing the median (middle line), the 25th and 75th percentiles (box limits), the minimum and maximum values (whiskers), and outliers (individual points) Source data are provided as a Source Data file.
Fig. 4
Fig. 4. CD35 expression on individual uEV (CD35-uEV) significantly decreases in sepsis-associated AKI.
A Heatmap revealing differentially expressed proteins on single uEV between SA-AKI and non-AKI groups; B PCA plot illustrating the discrimination between AKI and non-AKI based on differentially expressed proteins on single uEV; C Consensus bar chart identifying CD21 and CD35 as the most characteristic differential proteins across 5 algorithms; D Single-molecule fluorescence microscopy confirming colocalization of CD21 (red) and CD35 (red) with uEV markers (CD81, green; CD63, yellow) at single vesicle; E Western blot showing significantly decreased CD35 expression in the SA-AKI compared to non-AKI group. CD21 and CD35 expression was normalized to EV marker, CD9 (n = 3 for Healthy control (HC), AKI and Non-AKI group respectively, pairwise comparisons between groups were performed using paired two-tailed t-test); F CD21 and CD35 were normalized to uEV protein concentration (c(uEV)) detected by BSA assay, data are presented as mean with SD (AKI n = 3, Non_AKI n = 3, HC n = 3, pairwise comparisons between groups were performed using paired two-tailed t-test). Source data are provided as a Source Data file.
Fig. 5
Fig. 5. CD35-uEV discriminates SA-AKI from non-AKI patients and correlates with AKI severity.
A Sample processing and detection workflow of SA-AKI cohort (n = 134, collected within 24 h after clinical diagnosis of AKI) (Image was created in BioRender. Li, N. (2025) https://BioRender.com/d94efgw); B Expression differences of CD35-uEV among various groups (Mann–Whitney U two-sided statistics). CD35 at single EV (CD35-uEV) was calculated by total CD35 measured by ELISA normalized to EV account; C ROC curve illustrating the ability of CD35-uEV to discriminate AKI from non-AKI sepsis patients (AUC-ROC 0.89, 95% CI 0.83–0.95); D CD35-uEV levels across AKI severity stages were analyzed using Mann–Whitney U two-sided statistics (Compared in pairs) (Non-AKI: n = 44, Stage1: n = 29, Stage2: n = 31, Stage3: n = 10); E Comparative analysis of CD35-uEV concentrations between transient versus persistent AKI was conducted with Mann–Whitney U two-sided statistics (p = 6.1E−5, Transient-AKI: n = 27, Persistent-AKI: n = 43); F ROC curve for CD35-uEV in predicting persistent AKI; G Correlation between CD35-uEV and median recovery time from AKI (log-rank test, p-value: 0.037). The blue and pink translucent bands indicate the 95% confidence intervals (error bands) for the low-risk and high-risk groups, respectively; HJ Correlation (general linear regression) between CD35-uEV and peak serum creatinine (Max_Scr) (r = −0.44, 1.5E−6) (H), procalcitonin levels (r = −0.26, p = 0.009) (I) and hypersensitive C-reactive protein (hs-CRP) levels (r = −0.27, p = 0.006) (J); K The General linear regression based restricted cubic spline curve revealed that CD35-uEV are an independent predictor of the lowest eGFR. Source data are provided as a Source Data file.
Fig. 6
Fig. 6. Association of CD35-uEV with short and long-term adverse outcomes.
A Correlation analysis (general linear regression) between CD35-uEV levels and ICU length of stay (r = −0.035, p = 0.79); B Comparison of CD35-uEV expression between the renal replacement therapy (RRT) and non-RRT groups revealed no significant difference (p = 0.503, Mann–Whitney U two-sided statistics; RT: n = 14, No-RT: n = 51); C. ROC curve for CD35-uEV predicting the need for renal replacement therapy (AUC-ROC 0.57, 95% CI 0.38–0.76); D CD35-uEV expression was significantly reduced in patients who died during the study (p = 0.043, Mann–Whitney U two-sided statistics; Death group: n = 11, Alive group: n = 53); E ROC curve for CD35-uEV predicting mortality (AUC-ROC 0.70, 95% CI: 0.54–0.86); F Kaplan–Meier survival analysis (log-rank test) for patients stratified by high and low CD35-uEV levels revealed a trend towards longer survival in the high CD35-uEV group, though this did not reach statistical significance (p = 0.12). The blue and pink translucent bands indicate the 95% confidence intervals (error bands) for the low-risk and high-risk groups, respectively; G CD35-uEV expression was markedly reduced in patients who progressed to acute kidney disease (AKD) (p = 0.045, Mann–Whitney U two-sided statistics; AKD group: n = 27, Non-AKD group: n = 39); H ROC curve for CD35-uEV predicting AKD (AUC-ROC 0.66, 95% CI 0.53–0.79); I Comparison of CD35-uEV expression in SA-AKI patients who progressed to chronic kidney disease (CKD, n = 23) and who did not (non-CKD, n = 54) (p = 0.234) (Mann–Whitney U two-sided statistics); J ROC curve for CD35-uEV to predict CKD (AUC-ROC 0.59, 95% CI 0.45–0.72). Data are presented as box plots showing the median (middle line), the 25th and 75th percentiles (box limits), the minimum and maximum values (whiskers), and outliers (individual points). Source data are provided as a Source Data file.
Fig. 7
Fig. 7. Detection of CD35-uEV enables early diagnosis and prognosis of subclinical AKI.
A Workflow for sample collection and analysis of E-AKI cohort (n = 72), with samples collected 12 h post diagnosis of sepsis, prior to a clinical diagnosis of AKI (Image was created in BioRender. Li, N. (2025) https://BioRender.com/6zj1ctq); B CD35-uEV levels were significantly reduced in subclinical AKI compared to non-AKI sepsis patients (p = 6.0E−7, Mann–Whitney U two-sided statistics); C ROC curve illustrating the predictive accuracy of CD35-uEV for subclinical AKI (AUC-ROC 0.84, 95% CI 0.74–0.94); D CD35-uEV levels decreased progressively with increasing AKI stages (Mann–Whitney U two-sided statistics (Compared in pairs), Non-AKI: n = 46, Stage1: n = 11, Stage2: n = 11, Stage3: n = 4); E ROC curve for CD35-uEV predicting AKI severity in subclinical AKI patients (AUC-ROC 0.69, 95% CI 0.49–0.89); F Significant reduction of CD35-uEV in patients progressing to persistent AKI compared to those with transient AKI (p = 0.04, Paired two-tailed t-test, Transient-AKI: n = 11, Persistent-AKI: n = 15); G ROC curve demonstrating the prediction of CD35-uEV for persistent AKI in subclinical AKI patients (AUC-ROC 0.72, 95% CI 0.52–0.92); H Logistic regression-based restricted cubic spline analysis identified CD35-uEV as an independent diagnostic factor for subclinical AKI (p < 0.001) (adjusting for age, gender, history of hypertension, diabetes, and cardiovascular disease, as well as urine output, SOFA scores, pathogen identification, and catecholamine use), the pink translucent band represents the 95% confidence interval (error bands); I Correlation (general linear regression) of CD35-uEV levels with the peak serum creatinine (Max_Scr) (r = −0.32, p = 0.008) in subclinical AKI patients post-admission. Source data are provided as a Source Data file.
Fig. 8
Fig. 8. Multi-omics analysis reveals origin of CD35-uEV from injured podocytes.
A Regional proteomic analysis revealed CD35 localization within the glomeruli, with a marked decrease in expression in AKI groups (Kidney Precision Medicine Project database: https://atlas.kpmp.org/); B Single-cell clustering analysis of pneumonia-associated AKI identified distinct cell populations, including injured podocytes; C Localization of CD35 in podocytes which reduced in the injured population; D Differential gene expression analysis demonstrated a significant reduction of CD35 in podocytes from AKI patients (based on limma package); E KEGG pathway enrichment analysis highlighted the upregulation of inflammatory and injury-related pathways in AKI podocytes (KEGG pathway enrichment was performed via hypergeometric testing with Benjamini-Hochberg FDR correction, threshold: FDR ≤ 0.05); F Cytotrace analysis identified injured podocytes in a dedifferentiated state; G Pseudotime analysis traced the trajectory of normal podocyte differentiated into injured states, H characterized with decline of CD35 during AKI progression; I Spatial transcriptomic mapping showed spatial distribution of injured podocytes (Spatial mapping of single-cell transcriptomic annotations onto spatially resolved transcriptomic profiles). J Raincloud plot illustrating significantly reduced CD35 expression in injured podocytes at the spatial transcriptomic level (Injury podocyte, n = 7 data mapped cells; normal podocyte, n = 7 data mapped cells, Mann–Whitney U statistics, p = 0.012). Data are presented as box plots showing the median (middle line), the 25th and 75th percentiles (box limits), the minimum and maximum values (whiskers), and outliers (individual points). Podo podocyte, Podo_inj injured podocyte. Source data are provided as a Source Data file.

References

    1. Poston, J. T. & Koyner, J. L. Sepsis associated acute kidney injury. BMJ Brit. Med. J.364, k4891 (2019). - PMC - PubMed
    1. Peerapornratana, S., Manrique-Caballero, C. L., Gómez, H. & Kellum, J. A. Acute kidney injury from sepsis: current concepts, epidemiology, pathophysiology, prevention and treatment. Kidney Int.96, 1083–1099 (2019). - PMC - PubMed
    1. Balkrishna, A. et al. Sepsis-mediated renal dysfunction: pathophysiology, biomarkers and role of phytoconstituents in its management. Biomed. Pharmacother.165, 115183 (2023). - PubMed
    1. van Niel, G., D’Angelo, G. & Raposo, G. Shedding light on the cell biology of extracellular vesicles. Nat. Rev. Mol. Cell Biol.19, 213–228 (2018). - PubMed
    1. Mori, M. A., Ludwig, R. G., Garcia-Martin, R., Brandão, B. B. & Kahn, C. R. Extracellular miRNAs: from biomarkers to mediators of physiology and disease. Cell Metab.30, 656–673 (2019). - PMC - PubMed

LinkOut - more resources