. 2025 Aug;26(8):1339-1351.
doi: 10.1038/s41590-025-02228-1. Epub 2025 Jul 29.

PD-1 is requisite for skin TRM cell formation and specification by TGFβ

Affiliations

PD-1 is requisite for skin TRM cell formation and specification by TGFβ

K Sanjana P Devi et al. Nat Immunol. 2025 Aug.

Abstract

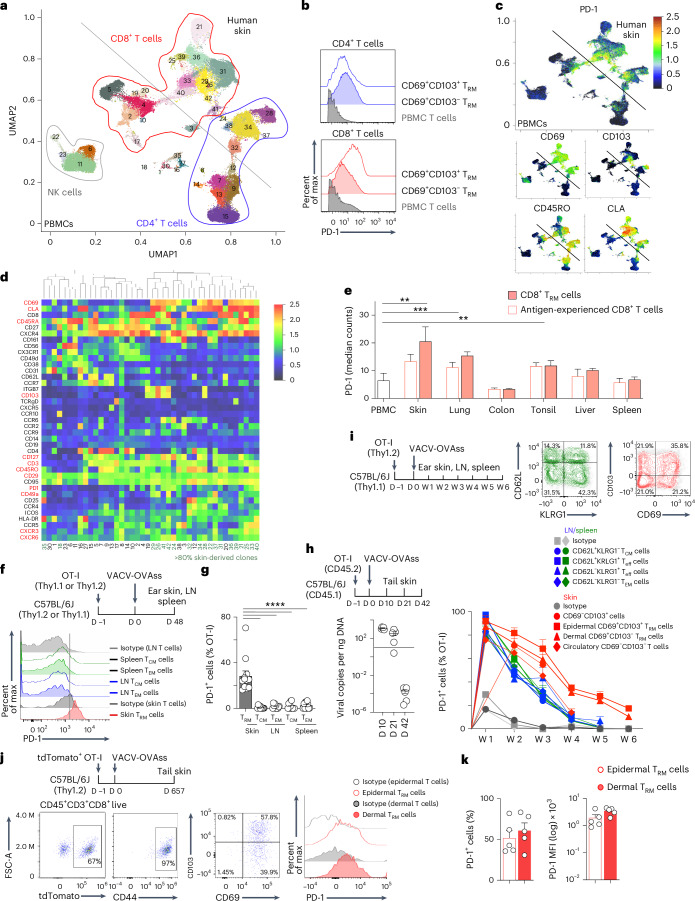
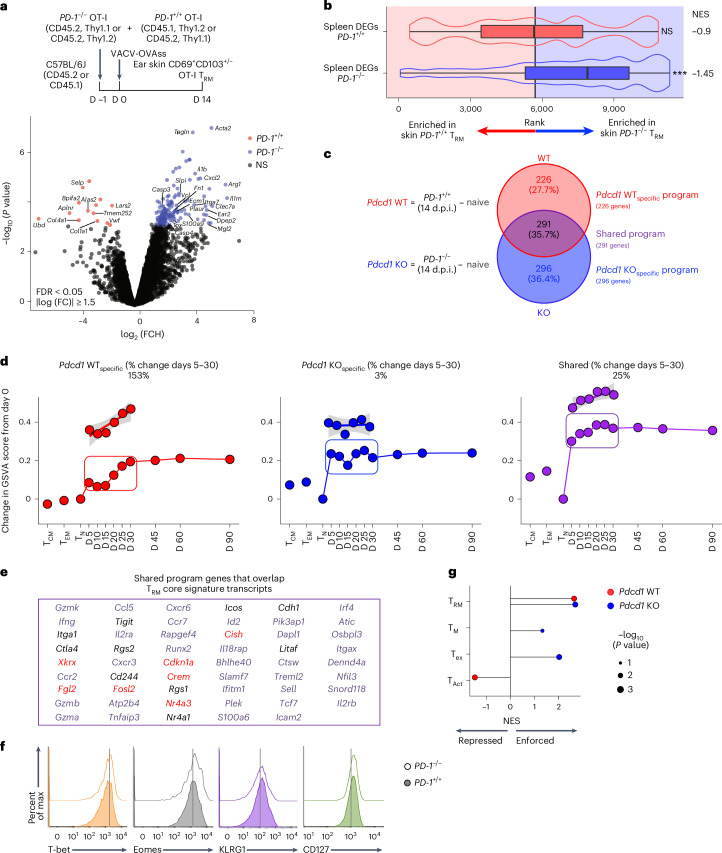
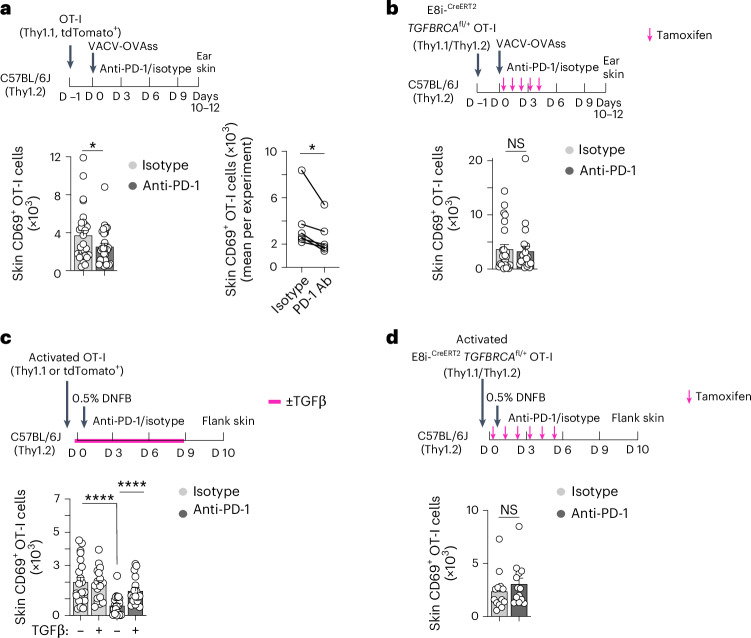
Tissue-resident memory T (TRM) cells provide infectious, cancer and vaccine-trained immunity across barrier sites. TRM cells are implicated in autoimmunity, successful response to immune checkpoint blockade in the tumor microenvironment and toxicities that occur after immune checkpoint blockade in peripheral tissues. Here, we identified that signaling through the immune checkpoint programmed death receptor 1 (PD-1) strongly impacts the early specification of CD8+ TRM cells in the skin. PD-1 is expressed broadly across mouse and human skin TRM cells, in the absence of persistent infection, and is retained on skin TRM cells in aged mice. PD-1 supports early TRM cell colonization, skin-specific programming and silencing of other differentiation programs and promotes TGFβ responsivity and skin engraftment. Thus, PD-1 signaling mediates skin TRM cell specification during immune initiation. These findings may inform therapeutic PD-1 agonist and antagonist use to modulate successful peripheral memory.


Conflict of interest statement

Competing interests: G.J.F. has patents/pending royalties on the PD-1/PD-L1 pathway from Roche, Merck MSD, Bristol-Myers-Squibb, Merck KGA, Boehringer-Ingelheim, AstraZeneca, Dako, Leica, Mayo Clinic and Novartis. G.J.F. has served on advisory boards for Roche, Bristol-Myers-Squibb, Xios, Origimed, Triursus, iTeos, NextPoint, IgM, Jubilant, Trillium and GV20. G.J.F. has equity in Nextpoint, Triursus, Xios, iTeos, IgM and GV20. S.N. is cofounder of Stara Biosciences and serves on the scientific advisory board of Seed. E.W.N. is a cofounder, advisor and shareholder of ImmunoScape and is an advisor for Neo-gene Therapeutics. C.J.N. is an employee and shareholder of Werewolf Therapeutics. M.S.-F. has been a consultant for Symbrio, SpectralMD and DBV. R.A.C. is on the scientific advisory board for AAAS, Almirall and Sedec Therapeutics. N.A. serves on the scientific advisory board of Shennon Biosciences and Panther Life Sciences and is a consultant or lecturer for Johnson and Johnson, Immunitas, 3T, 23andme, Cellino, Kumquat, Verrica, Lytix, Network Bio and Genmab. The other authors have no conflicts to declare.

Figures

Fig. 1
Fig. 1. PD-1 is retained on mouse and human CD8+ TRM cells in the absence of persistent antigen.
a, CyTOF uniform manifold approximation and projection plots showing the relative expression of PD-1 protein on T cells with the relative distribution of NK cells, CD8+ T cells and CD4+ T cells in human PBMCs versus human skin. After biexponential transformation, each plot is normalized to minimum and maximum intensities, based on downsampled and combined flow cytometry standard (FCS) files of human PBMCs (n = 4, combined with roughly equal weight) and human skin (n = 5, combined with roughly equal weight). b, Representative histogram plot of PD-1 expression on CD4+ or CD8+ CD69+CD103+/−CD4+ TRM cells or CD69+CD103+/−CD8+ TRM cells isolated from human skin (n = 5, combined) and PBMCs (n = 4, combined). c, Expression of PD-1, CD69, CD45RO, CD103 and CLA on CD4+ and CD8+ T cells from human skin versus PBMCs as in b. d, Heat map of immune checkpoint, activation and chemokine molecules derived from the CyTOF phenograph or Louvain clusters (shown as median intensity); green, skin-specific clusters; red, common markers of TRM cells. e, Median PD-1 intensity (number of ions detected by CyTOF) ± s.e.m. for total antigen-experienced CD45RO+CD45RACD8+ T cells (CD8+ TRM cells) or antigen-experienced CD45RO+CD45RACD69+CD49+CD8+ TRM cells (antigen-experienced T cells) across PBMCs (n = 4), skin (n = 5), lung (n = 4), colon (n = 6), tonsil (n = 5), liver (n = 3) and spleen (n = 3). Linear model with heterogenous variance, with site as a fixed effect; **P ≤ 0.01; ***P ≤ 0.001. f, Schematic showing Thy1.2+ or Thy1.1+ C57BL/6J mice injected intravenously with 2 × 105 Rag1−/− Thy1.1+ or Thy1.2+ OT-I T cells (OT-I cells, unless otherwise specified) infected with VACV-OVAss at day 0 followed by identification of donor Thy1.1+/Thy1.2+Va2+CD8+ OT-I cells at week 6 after infection with 1 × 106 viral plaque-forming units (p.f.u.) on each ear and 2 × 106 on the tail (top) and representative histogram of PD-1 expression based on staining with antibody clone RMP1-30 relative to isotype on CD69+CD103+/− TRM cells (skin TRM cells), spleen and LN KLRG1CD62L+ TCM cells (TCM cells) and spleen and LN KLRG1CD62L TEM cells (TEM cells) at week 6 after infection (bottom); D, day. g, Percentage of PD-1+ cells among CD69+CD103+/–CD8+ TRM, CD127+CD62L+CD8+ or KLRG1CD62L+CD8+ TCM and CD127+CD62LCD8+ or KLRG1CD62L CD8+ TEM cells isolated at week 6 from the spleen or LN of VACV-OVAss-infected mice as in f. Data were pooled from four independent experiments (n = 12) and were analyzed by unpaired t-test; ****P ≤ 0.0001. h, Real-time PCR of viral load in the tail skin of mice as in f at day 10, 21 or 42 after infection (n = 5 mice per time point); LOD, limit of detection (marked with a horizontal line); W, week. i, Schematic showing transfer of Thy1.2+ OT-I cells into Thy1.1 C57BL/6J mice at day –1 before skin scarification with VACV-OVA at day 0 and collection of skin, LN and spleen every week between weeks 1 and 6 after infection (left), representative flow cytometry plots of CD69 versus CD103 on CD8+ OT-I cells isolated from ear skin and KLRG1 versus CD62L on CD8+ OT-1 cells isolated from the LNs of Thy1.2+ C57BL/6J recipient mice at week 2 and week 1 after infection, respectively (middle), and frequency of PD-1+ cells in skin Thy1.2+Va2+CD8+PD-1+CD8+ OT-I cells, including CD69CD103+ cells, epidermal CD69+CD103+ TRM cells, dermal CD69+CD103 TRM cells and circulatory CD69CD103 T cells and KLRG1+/−CD62L+/− cells in LN and spleen, including CD62L+KLRG1 TCM cells, CD62L+KLRG1+ Teff cells, CD62LKLRG1+ Teff cells and CD62LKLRG1 TEM cells at weeks 1 to 6 after infection (right; n = 5–10 mice pooled from two independent experiments). j, Schematic showing tdTomato+ OT-I cells transferred to 6- to 8-week-old C57BL/6 mice at day –1, followed by skin scarification with VACV-OVA at day 0 and analysis of TRM cells in the tail skin at day 657 after infection (top), gating strategy on live CD45+CD3+CD8+ T cells (bottom left) and representative histograms showing the expression of PD-1 on epidermal TRM cells and dermal TRM cells at day 657 after infection (bottom right). Histograms were concatenated and calculated from five of six mice with robust detectable PD-1 staining (n = 2–4 mice per group from two independent experiments). k, Percentage of PD-1+ cells (left) and PD-1 mean fluorescence intensity (MFI; right) in epidermal CD69+CD103+ TRM cells (epidermal TRM cells) and dermal CD69+CD103 OT-I TRM cells (dermal TRM cells) isolated at day 657 from mice as in j (n = 5 mice). Bars and error bars show mean ± s.e.m.
Fig. 2
Fig. 2. PD-1 is required for epidermal and dermal TRM cell formation and specifies TRM cell fate.
a, Schematic showing the transfer of equal mixes of 1 × 105 each of PD-1+/+ CD45.2+Thy1.2+ C57BL/6J OT-I cells with PD-1−/− CD45.2+Thy1.1+ OT-I cells or PD-1+/+ CD45.2+Thy1.2+ OT-I cells with PD-1+/+ CD45.2+Thy1.1+ (sex-matched littermate controls of PD-1−/− CD45.2+Thy1.1+) OT-I cells into CD45.1 Thy1.2 C57BL/6J mice at day −1, followed by VACV-OVAss at day 0 and quantification of OT-I cells in the skin at days 10, 21 and 42 after infection (left) and quantification of the total number of PD-1+/+ or PD-1−/− CD3+CD8+Va2+CD69+CD103+/− OT-I TRM cells isolated from skin at days 10, 21 and 42 after infection (right). Data were pooled from three independent experiments (n = 14) at day 10, six independent experiments (n = 30) at day 21 and four independent experiments (n = 20) at day 42 for the PD-1+/+ + PD-1−/− mixes and from two independent experiments (n = 9) at day 10, one independent experiment (n = 4) at day 21 and three independent experiments (n = 12) at day 42 for PD-1+/+ + PD-1+/+ (littermate control) mixes. Statistical significance between the number of PD-1+/+ OT-I and PD-1−/− OT-I cells was estimated using a linear mixed-effects model with group by time interaction and replication as fixed effects and a random intercept for each mouse; *P ≤ 0.05; ***P ≤ 0.001; ****P ≤ 0.0001. b, Representative flow cytometry plots showing skin PD-1+/+ or PD-1−/− CD8+Va2+ OT-I cells from the mixed transfers as in at days 10, 21 and 42. c, Quantification of ear skin PD-1+/+ and PD-1−/− CD3+CD8+Va2+CD69+CD103+/− OT-I TRM cells in mice transferred with an equal mix of PD-1+/+ and PD-1−/− OT-I cells as in at day 42 after infection; ***P ≤ 0.001. d, Schematic showing the transfer of an equal mix of PD-1+/+ CD45.2 Thy1.2+ and PD-1−/− CD45.2+Thy1.1+ OT-I cells at day −1 into C57BL/6J mice, followed by VACV-OVAss at day 0, administration of BrdU by intraperitoneal injection daily at days 5–10 and isolation of T cells from ear skin at day 10 after infection (top) and representative flow cytometry plots and quantification (bottom) of the percentage of skin BrdU+ cells among PD-1+/+ or PD-1−/− cells among ear skin Va2+CD69+CD103+/− OT-I TRM cells (bottom; n = 18, data were pooled from three independent experiments). Bars and error bars show mean ± s.e.m. Statistics were estimated using a linear mixed-effects model with group by treatment interaction as fixed effects and a random intercept for each mouse; ****P ≤ 0.0001. e, Schematic showing the transfer of tdTomato+ OT-I cells into CD11c–eYFP recipient mice at day −1, followed by VACV-OVAss at day 0, intraperitoneal anti-PD-1 or isotype treatment on days 0, 3, 6 and 9 after infection, isolation of ear tissue at days 10–14 after infection (top) and representative immunofluorescence images showing tdTomato+ OT-I cells (white arrows), CD11c–eYFP+ DCs and DAPI nuclear staining in skin cross-sections from CD11c–eYFP mice at days 10–14 after infection (bottom). Dashed lines indicate the dermal–epidermal border. f, Quantification of tdTomato+ OT-I cells isolated from epidermal sheets of isotype- or anti-PD-1-treated C57BL/6J mice as in e on days 10–14 after infection; isotype, n = 12; anti-PD-1, n = 14. Data were pooled from three independent experiments. Statistics were estimated using a linear mixed-effects model with group by treatment interaction as fixed effects and a random intercept for each mouse. Bars and error bars show mean ± s.e.m.; *P ≤ 0.05. g, Schematic showing the transfer of tdTomato+ or Thy1.1+ C57BL/6J OT-I cells into Thy1.2+ C57BL/6J mice at day −1, followed by VACV-OVAss immunization at day 0, treatment with inhibitory anti-PD-1 or isotype by intraperitoneal injection on days 0, 3, 6 and 9 after infection, treatment with FTY720 by intraperitoneal injection every 2 days starting at day 35, challenge with topical PBS or SIINFEKL on the right (R) or left (L) depilated flank sites of each mouse at day 42, isolation of PBS- and SIINFEKL-treated flank skin at day 49 (left) and quantification of epidermal CD69+CD103+ TRM cells and dermal CD69+CD103 TRM cells from anti-PD-1- and isotype-treated mice at day 49 after infection (right). Data were pooled from four independent experiments; isotype, n = 13; anti-PD-1, n = 18. Statistics were estimated using a linear mixed-effects model with group and by treatment challenge as fixed effects and a random intercept for each mouse; **P ≤ 0.01; ***P ≤ 0.001.
Fig. 3
Fig. 3. PD-1-dependent programming is skin specific and highly enforced during skin TRM cell formation.
a, Schematic showing mixed adoptive transfer of PD-1+/+ CD45.1+Thy1.2+ or CD45.2+Thy1.1+ and CD45.2+Thy1.1+ or PD-1−/− CD45.2+Thy1.2+ OT-I cells into CD45.2 Thy1.2 C57BL/6J recipients at day −1, followed by VACV-OVAss infection in the ear and tail on day 0 and isolation and sorting of ear skin PD-1+/+ or PD-1−/− OT-I cells at day 14 after infection (top) and volcano plot depicting DEGs between skin PD-1+/+ and PD-1−/− OT-I cells (log (fold change) ≥ 1.5, FDR ≤ 0.05, P ≤ 0.05) isolated at day 14 after infection and analyzed by RNA-seq (Supplementary Tables 1 and 2); FCH, fold change. b, Gene set enrichment analysis (GSEA) showing the similarities between PD-1-dependent programming between skin PD-1−/− CD69+CD103+/− T cells and spleen PD-1−/− TCM cells isolated at day 14 after activation from mice in public datasets (E-MTAB-1569 (ref. )). For each spleen signature, the number of genes (n) and normalized enrichment score (NES) are annotated; ***P ≤ 0.001; NS, not significant. c, Schematic showing the generation of Pdcd1-WT and Pdcd1-KO transcriptomes by subtracting naive CD8+Va2+ OT-I cell signatures from skin PD-1+/+ and PD-1−/− OT-I TRM cells signatures, respectively (left), and Venn diagram showing the 226 transcripts (27.7%) specific to Pdcd1-WT transcriptomes (Pdcd1 WTspecific program), 296 transcripts (36.4%) specific to the Pdcd1-KO transcriptome (Pdcd1 KOspecific program) and 291 transcripts (35.7%) shared between the Pdcd1-WT and Pdcd1-KO transcriptomes (shared programs); d.p.i., days postinfection. d, Changes in Pdcd1 WTspecific, Pdcd1 KOspecific and shared gene programs defined as in c in skin TRM cells at specific time points during days 5–90 after VACV-SIINFEKLss in mice as in a relative to day 0 naive OT-I cells (GSE79805). The gene set variation analysis (GSVA) signature activity change between days 5 and 30 (boxed; percent change shown) was calculated using mixed effect models (MEMs; see Methods). e, Shared transcripts (291 genes) that overlap with TRM cell programming identified across skin, lung and gut TRM cell programs relative to naive T cells (Supplementary Tables 3–6). Black, unique TRM transcripts (common to three infections/sites and independent of TCM/TEM/naive T (TN) cells) within the TRM core; red, TRM transcripts present exclusively in TRM cells (and not significantly enriched in T activated (TAct), Tex or TM cells (Supplementary Fig. 3e)) and using public datasets from skin, lung and gut infections generating CD8+ T cell programs. f, Expression of CD127, KLRG1, T-bet and eomesodermin in CD45.2+Thy1.2+CD8+ or CD45.2+Thy1.1+CD8+ OT-I cells isolated at day 10 after VACV-OVAss from the flank skin of C57BL/6J mice after adoptive transfer with an equal mix of PD-1+/+ and PD-1−/− OT-I T cells at day −1 and infection with VACV-OVAss at day 0 as in Fig. 2a. g, Scoring of repressed and enforced programs of established exclusive viral T cell state signatures defined previously using public datasets from skin, lung and gut infections generating CD8+ T cell programs in Pdcd1-WT and Pdcd1-KO signatures as defined in c; ***P ≤ 0.001.
Fig. 4
Fig. 4. Pdcd1-KO-specific loss of TGFβ pathway programs.
a, Pathway analysis of skin TRM Pdcd1 WTspecific, Pdcd1 KOspecific and shared signatures as in Fig. 3c (FDR ≤ 0.05, P ≤ 0.05); TLR, Toll-like receptor. b, GSVA score of Pdcd1 KOspecific signature transcripts upregulated in day 14 skin PD-1−/− OT-I TRM cells compared to naive OT-I cells as in Fig. 3c (Pdcd1 KOspecific up) across publicly available transcriptomes from TGFβ-, IL-2- or TGFβ + IL-2-stimulated gBT HSV-specific splenocytes (GSE125471) scoring for the absence of TGFβ. The per-sample scaled GSVA score was modeled using MEM (Methods). Gray boxes represent the trajectories of an equal number of random probes. c, GSEA of Pdcd1 KOspecific up in the transcriptomes of gBT HSV-specific cells with TGFβ versus without TGFβ or with IL-2 + TGFβ versus IL-2 alone (GSE125471). d, Schematic showing the adoptive transfer of pre-activated Tgfbr2+/+ or Tgfbr2−/− OT-I cells into C57BL/6 mice at day 2 after HSV infection (left). Isolation of skin Tgfbr2+/+ or Tgfbr2−/− OT-I cells was performed at day 14 after infection (left), and GSEA comparison of HSV-specific skin Tgfbr2−/− (bottom; FDR ≤ 0.15, 297 genes) or Tgfbr2+/+ (top; FDR ≤ 0.15, 341 genes) TRM cell signatures at day 14 after infection (DEG; Supplementary Table 7) against skin PD-1+/+ versus PD-1−/− TRM cell signatures at day 14 after infection with VACV-OVAss was performed as in Fig. 3a. e, Tgfbr2−/− prioritized GSEA leading-edge genes (showing 96 of 297 transcripts). f, Schematic showing the transfer of tdTomato+ or Thy1.1+ C57BL/6J OT-I cells into Thy1.2+ C57BL/6J mice at day −1, followed by VACV-OVAss immunization to the ears and tail at day 0, intraperitoneal treatment with either isotype control or inhibitory anti-PD-1 on days 0, 3, 6 and 9 after infection and isolation of spleen and dLN cells at days 14–15 after infection (left) and representative histograms of CXCR3, CXCR6 and phospho-SMAD2 (pSMAD2) expression in spleen CD3+CD8+CD44+(CXCR6+)OT-I cells at day 15 after infection (right). g, Mean fluorescence intensity of CXCR3, CXCR6 and pSMAD2 in CD44+CD8+ OT-I cells isolated from the LNs and spleens of isotype-treated (n = 10) or anti-PD-1-treated (n = 10) mice at days 14–15 after infection as in f. Data were pooled from two independent experiments and were analyzed by unpaired t-test; *P ≤ 0.05; **P ≤ 0.01; ***P ≤ 0.001.
Fig. 5
Fig. 5. Constitutive TGFβR signaling rescues the anti-PD-1-dependent inhibition of TRM cell formation and engraftment in a cell-autonomous manner.
a, Schematic showing Thy1.1+ or tdTomato+ OT-I cell transfer into Thy1.2+ C57BL/6J mice at day −1, VACV-OVAss immunization at day 0, treatment with anti-PD-1 or isotype control at days 0, 3, 6 and 9 after infection and isolation of ear skin at days 10–12 after infection (top) and quantification (bottom left) and mean number of cells per experiment (bottom right) of skin CD69+CD103+/–CD8+ OT-I cells from anti-PD-1- or isotype (Iso)-treated mice at days 10–12 after infection. Data were pooled from six independent experiments (n = 29 total per group). b, Schematic showing transfer of Thy1.1+/Thy1.2+ E8iCreERT2Tgfbrcafl/+ OT-I cells into Thy1.2+ C57BL/6J mice as in a that were also intraperitoneally injected with tamoxifen at days 0–4 after infection, ear skin was collected at days 10–12 after infection (top) and quantification of donor E8iCreERT2Tgrbrcafl/+ CD8+CD69+CD103+/− OT-I cells in the skin of isotype- and anti-PD-1-treated mice at days 10–12 after infection; isotype, n = 24; anti-PD-1, n = 22. Data were pooled from four independent experiments. c, Schematic showing the activation of Thy1.1+ or tdTomato+ OT-I splenocytes in vitro by culture with SIINFEKL peptide and IL-2 for 3.5 days and in vivo adoptive transfer of activated OT-I cells into Thy1.2+ C57BL/6J mice by intravenous tail vein injection, topical application of 0.5% DNFB on depilated flank skin at day 0, intraperitoneal injection with either anti-PD-1 or isotype control at days 0, 3, 6 and 9 after DNFB application, administration (or no administration) of 0.5 µg of TGFβ1 daily at days 1–9 and isolation of flank skin tissue at day 10 (top) and quantification of donor skin CD8+CD69+CD103+/− OT-I cells in anti-PD-1- or isotype-treated mice that received TGFβ1 at day 10 after DNFB or not (bottom); isotype, n = 21; anti-PD-1, n = 23. Data were pooled from six independent experiments in mice without TGFβ1; isotype, n = 17; anti-PD-1, n = 17. Data were pooled from three independent experiments in mice with TGFβ1. The differences between anti-PD-1- and isotype-treated mice or between mice treated with or without TGFβ1 were modeled using MEM on original-scale (a and d) or log-transformed data (c; see Methods, statistics). d, Schematic showing the transfer of Thy1.1+/Thy1.2+ E8iCreERT2Tgfbrcafl/+ OT-I cells as in c, but without TGFβ treatment and with tamoxifen treatment on days 0–5 after DNFB (top) and quantification of donor skin E8iCreERT2Tgfbrcafl/+ CD69+CD103+/–CD8+ OT-I cells in anti-PD-1- or isotype-treated mice on day 10 (bottom); isotype, n = 13; anti-PD-1, n = 13. Data were pooled from three independent experiments. Bars and error bars show mean ± s.e.m. Statistics were estimated using a linear mixed-effects model with group by treatment interaction, anatomic site when relevant, as fixed effects and a random intercept for each mouse or replicate; *P ≤ 0.05; ****P ≤ 0.0001.
Extended Data Fig. 1
Extended Data Fig. 1. PD-1 is rapidly expressed on activated T cells but retained on TRM after VACV-OVAss.
a. Human skin and b. PBMCs showing the relative distribution of NK, CD8+ and CD4 + T cell clusters by CyTOF analysis. c. Quantification of cell percent derived from skin phenograph or louvain clusters. Green lines represent 80% skin specific clusters while blue lines are clusters that are less than 80% skin specific. d. Schematic showing Thy1.1 C57BL/6J OT-1 cells were transferred into Thy1.2 C57BL/6J mice at day −1 followed by VACV-OVAss immunization on day 0 and early harvest kinetics (top). PD-1 expression on OT-I cells isolated from the draining LN (dLN), non-draining LNs, and spleen at 0, 48, 72 and 120 hours after mice received 2 × 10⁶ viral pfu on ear by VACV-OVAss. Flow cytometry of data from one individual mouse is shown per time point (bottom). e. Representative flow cytometry of Vα2 + Vβ5 + CD8+ populations 0, 48, 72 and 120 hours post-infection. f. Day 42 representative flow cytometry gating showing percent of cells with PD-1 cell surface expression using anti-PD-1 clone: RMP1-30 or g. using anti-PD-1 clone: 29 F.1A12. Quantification of percent fraction of PD-1 expressing skin TRM relative to LN and spleen TCM or TEM populations at 6 weeks using anti-PD-1 clone 29 F.1A12 (left). Each dot represents individual mice. h. Schematic showing Thy1.2 + OT-I cell were transferred into Thy1.1 + C57BL/6J mice at day −1, followed by VACV-OVAss (4 × 10⁶ viral pfu on ear and tail) on day 0, and skin, LN and spleen harvest at 1 to 6 weeks post-infection (left). PD-1 geometric mean fluorescence intensity (MFI) on skin, spleen, and LN CD8 + OT-I cell subsets between 1 to 6 weeks post infection (middle). CD69 and CD103 cell-surface expression was used to gate four quadrants of CD8 + OT-I cells in skin. TRM were gated from Va2 + CD8+Thy1.2+ donor cells, and defined as CD69 + CD103+ (epidermal) or CD69 + CD103- (dermal). TCM and TEM were identified by KLRG1-/CD62L+ and KLRG1-/CD62L- gating respectively, while TEffector were defined by KLRG1 + CD62L +/− in LN and spleen (right). i. Schematic of OT-I Thy1.1 transfer into Thy1.2 recipients with immunization as in h. but with harvest of flank, ear, and tail skin at day 10–12 post-infection (top). PD-1 representative histograms of epidermal CD69 + CD103+ or dermal CD69 + CD103- skin OT-I TRM of ear, flank, and tail skin were concatenated from 5 mice per site (bottom). j. % PD-1 positive cells in flank, ear, and tail dermal and epidermal TRM, with mean fluorescence intensity (MFI) of PD-1+ populations. An unpaired T-test was performed for g. Bars and error bars show mean +/- SEM. +p ≤ 0.1 * p ≤ 0.05; ** p ≤ 0.01; *** p ≤ 0.001; **** p ≤ 0.0001.
Extended Data Fig. 2
Extended Data Fig. 2. Comparative analysis of PD-1−/− and PD-1 +/+ skin T cells post infection, and naïve T cells.
a. Schematic showing mixed adoptive transfer of either 1 × 10⁵ each of PD-1 +/+ (red) with PD1−/− (blue) OT-I cells, or PD-1 +/+ OT-I (dark gray) with PD-1 +/+ OT-I (light gray) littermate gender-matched controls into C57BL/6J recipients at day −1, followed by VACV-OVAss immunization at day 0 (top). Donor OT-I quantification was performed from LN and spleen on days 10, 21 and 42 post-infection (bottom). Mixed pairs were distinguished using CD45.1, CD45.2, Thy1.2 and/or Thy1.1 congenic markers. Data were pooled from 3 independent experiments (n = 14) at day 10, 6 independent experiments (n = 30) at day 21, and 4 independent experiments (n = 20) at day 42. Control C57BL/6J mice were pooled from 2 independent experiments (n = 9) at day 10; 1 independent experiment (n = 4) at day 21 and 3 independent experiment (n = 12) at day 42. Statistical significance between the number of PD-1 +/+ OT-I (red box) and PD-1−/− OT-I cells (blue box). *p ≤ 0.05; **p ≤ 0.01; ***p ≤ 0.001 Total number (log) of CD3 + CD8 + Va2 + CD62L + TCM in PD-1 +/+ OT-I (red) and PD-1−/− OT-I cells (blue) isolated from LN. CD8 + TCM were identified in the LN based on the expression of CD44 + /CD127+ and CD62L+ gating. b. Representative flow cytometry of LN OT-I cells. PD-1 +/+ OT-I (red) and PD-1−/− OT-I cells (blue). c. Total number (log) of CD3 + CD8 + Va2 + , CD3 + CD8 + Va2 + CD62L + TCM and CD3 + CD8 + Va2 + CD62L- TEM in PD-1 +/+ OT-I (red) and PD-1−/− OT-I cells (blue) isolated from LN and spleen of hosts, after mixed transfers. Quantification of OT-I cells from mixed transfer controls receiving PD1 +/+ C57BL/6J OT-I cells (dark gray lines) mixed 1:1 with PD-1 +/+ OT-I+ littermates to the PD-1−/− (light gray lines) was included to rule out genetic mismatch. TCM and TEM were identified in spleen based on the expression of CD44 + /CD127+ and CD62L+ or CD62L- respectively on CD8 + T cells. In some littermate control analyses, TCM and TEM were identified by KLRG1-/CD62L+ and KLRG1-/CD62L- gating respectively. Significance of the difference between PD-1 +/+ OT-I (red) and PD-1−/− OT-I cells (blue) OT-I cells isolated after mixed transfer. d. Representative flow cytometry of spleen OT-I cells 10, 21, and 42 days post-infection in mice receiving mixed transfers of PD-1 +/+ OT-I (red box) and PD-1−/− OT-I cells (blue box) OT-I cells. Statistical analysis was estimated using a linear mixed-effects model with group by time interaction, and replication as fixed effects and a random intercept for each mouse. Bars and error bars show mean ± SEM. +p ≤ 0.1 * p ≤ 0.05; ** p ≤ 0.01; *** p ≤ 0.001; **** p ≤ 0.0001.
Extended Data Fig. 3
Extended Data Fig. 3. LN early BrdU, Ki67, and live/dead comparisons; early anti-PD1 effects on circulating memory in spleen & LN.
a. Schematic showing mixed adoptive transfer of 1 × 10⁵ each of CD45.1 + /Thy1.1+ or Thy1.1 + WT and Thy1.1+ or CD45.1 + /Thy1.1 + KO OT-I cells into Thy1.2 + C57BL/6J recipients at day −1, followed by VACV-OVAss immunization on ear and tail at day 0 (top). BrdU was given to mice starting on day 0 and provided on consecutive days between days 0–2, 0–4 or 0–6 until harvest on day 3, 5, and 7 respectively. Data were pooled from 2 independent experiments each for day 3 (n = 12), 5 (n = 12), and 7 (n = 12). Mixed pairs were distinguished using CD45.1, CD45.2, Thy 1.2 and/or Thy 1.1 congenic markers. Percent (left) and total counts (right) of PD-1 +/+ OT-I and PD-1−/− donor OT-I cells are given with a line to connect the paired samples by mouse. b. Percent (left) and total counts (right) of BrdU+ cells from the PD-1 +/+ OT-I and PD-1−/− donor OT-I. c. Percent (left) and total counts (right) of Ki67+ cells from PD-1 +/+ OT-I and PD-1−/− donor OT-I. d. Percent (left) and total counts (right) of Live/Dead Blue+ cells from PD-1 +/+ OT-I and PD-1−/− donor OT-I. e. Schematic showing tdTomato+ or Thy1.1 + OT-I cells were transferred into Thy1.2 + C57BL/6J recipients at day −1, followed by VACV-OVAss immunization at day 0, and treatment with either PD-1 Ab or isotype administered on days 0, 3, 6, and 9 post-infection (top). FTY720 was given every 2 days starting at day 35. At day 42, contralateral R and L depilated flank sites of the same mouse were challenged with topical PBS or SIINFEKL. dLN and spleen were harvested at day 49. Quantification of total KLRG1-CD62L + OT-I TCM numbers (log) from the dLN of the PBS-challenged skin site versus those from the dLN of the SIINFEKL-challenged skin site (bottom, left). Quantification of spleen KLRG1-CD62L + TCM (bottom, middle) and KLRG1-CD62L- TEM (bottom, right). A paired t-test was performed for a-d. Elsewhere, statistics were estimated using a linear mixed-effects model with group and by treatment challenge, as fixed effects and a random intercept for each mouse. Comparisons of KLRG1-CD62L + TCM numbers in PBS versus SIINFEKL-dLN of the same mouse, are shown in red or blue. Data were pooled from 4 independent experiments (Isotype, n = 13; anti-PD-1, n = 18). Bars and error bars show mean ± SEM. +p ≤ 0.1 * p ≤ 0.05; ** p ≤ 0.01; *** p ≤ 0.001; **** p ≤ 0.0001.
Extended Data Fig. 4
Extended Data Fig. 4. Transcriptomics supporting selection of PD-1 sufficient T cell in skin.
a. Schematic of mixed adoptive transfer of PD-1 +/+ with PD-1−/− OT-I T cells, VACV-OVAss (4 × 10⁶ viral p.f.u. on ear and tail), and d14 isolation from skin (top). ATAC sequencing of the PD-1 gene locus shows the lack of PD-1 accessibility in naïve T cells and confirms the presence or absence of exons 2 and 3 in PD-1−/− OT-I T cells (bottom). b. Relative enrichment of ECM/GPCR pathway scores comparing donor skin gB-T CD8 + CD103 + TRM isolated from the skin of C57/BL6 mice 30 days post-infection with HSV, versus naive gB-T cells (GSE47045). Pathway enrichment scores were generated using the GSVA ssGSEA algorithm. c. Relative enrichment of ECM/GPCR pathway scores during VACV-SIINFEKL skin OT-I TRM differentiation (GSE79805). Pathway enrichment scores were generated using the GSVA ssGSEA algorithm and normalized by subtracting naïve T cell scores from all samples. d. Scatter plot depicting expression differences of transcripts in PD-1 +/+ vs PD-1−/− T cells in skin and spleen with DEGs in skin (logFC≥1.5, FDR ≤ 0.05, green), spleen (FDR ≤ 0.05, p ≤ 0.05, yellow) or both (purple), and % of all DEGs (n = 328) within each quadrant. Genes that were not differentially expressed by either skin or spleen T cells are depicted as a contour plot (gray). e. Expression of transcription factors (T-bet, Eomes) in PD-1 +/+ OT-I and PD-1−/− OT-I T cells isolated from LN and spleen at day 10, and expression levels of cell surface markers (CD127, KLRG1) on PD-1 +/+ OT-I and PD-1−/− donor OT-I T cells isolated from ear skin of mice on day 21 or 42 post VACV-OVAss. f. Fisher exact test of exclusive T cell differentiation state signatures in Shared, PD-1−/−specific, or WTspecific programs. g. Fisher exact test of non-exclusive (global) CD8 + T cell differentiation state signatures in shared, PD-1−/−specific, or WTspecific programs. Up and down triangles indicate enrichment driven by transcripts either upregulated or downregulated respectively in day 14 skin OT-I relative to naïve controls. Both size and color indicate the level of enrichment.
Extended Data Fig. 5
Extended Data Fig. 5. WTspecific and Shared program scoring to T cells activated +/- TGFβ and IL-2.
a. Gene Set Variation Analysis score of Shared (purple) and WTspecific (red) transcripts upregulated in skin OT-I vs naïve controls (Sharedup, WTspecific Up, Y-axis) across the transcriptomes from TGFβ/IL2/TGFβ + IL2 stimulated OT-I (GSE125471). Gray boxes represent relative activity of an equal number of random probes. The scaled GSVA score was modelled using MEM (see Methods) with treatment as a fixed effect and a random intercept for each experiment.
Extended Data Fig. 6
Extended Data Fig. 6. Anti-PD-1 administration during priming does not impact T cell accumulation in LN and spleen.
a. Schematic showing Thy1.1 OT-I cell transfer at day −1 into C57Bl/6J Thy.2 recipients with VACV-OVAss immunization at day 0, and treatment with either isotype or anti-PD-1 0, 3, 6, 9 days post-infection (top). LN and spleen were harvested between days 10–12. Quantification of total donor CD8 + OT-I cell number (log). Data were pooled from 6 independent experiments (n = 29 mice per group). Individual mice are shown (middle) and mean per experiment (bottom) b. Schematic showing identical setup as in a. but either isotype or anti-PD-1 was administered 6, 9, and 12 days post-infection (top). Ear skin, LN, and spleen were harvested at day 13. Quantification of total donor skin CD69 + CD103 + /-CD8 + OT-I cells and LN (log), spleen (log) donor CD8 + OT-I cells. Data were pooled from 2 independent experiments pooled (Isotype, n = 9; anti-PD-1, n = 10). Individual animals are shown (middle) and mean per experiment (bottom) c. Schematic showing identical setup as in a. Representative histogram of cell-surface PD-1, TGFβRI and TGFβRII in CD69 + CD103 + /-CD8 + OT-I TRM cells isolated from ear. Histogram of cell-surface PD-1 in OT-I cells isolated from LN and spleen compared to isotype stain. d. Schematic showing identical setup as in a. but with E8i-CreERT2 TGFβRCAfl/+ Thy 1.1/1.2 OT-I cells (top). Tamoxifen was additionally given for 5 consecutive days from days 0–4. Quantification of donor CD8 + TGFβRCAfl/+ Thy 1.1/1.2 OT-I cells (log) from LN and spleen. Data were pooled from 4 independent experiments (Isotype, n = 24; anti-PD-1, n = 22). Individual animals are shown (middle) and mean per experiment (bottom) e. Representative cell-surface PD-1 levels in LN and spleen TGFβRCA fl/+ OT-I cells as in d. to show anti-PD1 targeting effect compared to isotype staining. The difference between anti-PD-1 and isotype treated groups (a and d) were modelled using log transformed data (see statistics section). Statistics were estimated using a linear mixed-effects model with group by treatment interaction, anatomic site and phenotype when relevant, as fixed effects and a random intercept for each mouse or replicate. Bars and error bars show mean ± SEM. +p ≤ 0.1 * p ≤ 0.05; ** p ≤ 0.01; *** p ≤ 0.001; **** p ≤ 0.0001.
Extended Data Fig. 7
Extended Data Fig. 7. In vitro activation of OT-I and engraftment.
a. Schematic of ‘Prime and Pull’ to isolate TRM engraftment (left). Prime: Thy1.1 or TdTomato+ OT-I splenocytes were activated in vitro by culture with SIINFEKL peptide and IL-2. Pull: At day 3.5, activated OT-I cells were adoptively transferred in vivo into Thy1.2 C57BL/6J recipients by intravenous (i.v.) tail vein injection and ‘pulled’ into skin without antigen (engraftment) using 0.5% DNFB (a hapten) applied topically on depilated flank skin to induce inflammation. Mice were treated with either anti-PD-1 or isotype 0, 3, 6, and 9 days after DNFB application. In some groups, TGF-β1 cytokine (0.5 µg) was administered daily throughout the engraftment period (d1-9). Quantification of percent Live/Dead Aqua+ of donor OT-I cells isolated from flank skin on day 10 from groups without TGF-β1 treatment. Each dot represents individual mice (middle) and mean per experiment (right). Data were pooled from 6 independent experiments (Isotype, n = 21; anti-PD-1, n = 23). b. Quantification of donor OT-I CD44 + CD62L + TCM and CD44 + CD62L− TEM from LN and spleen of recipient mice as in a. Individual animals are shown (top) and mean per experiment (bottom). Data were pooled from 6 independent experiments in the groups without TGF-β1 treatment (Isotype, n = 21; anti-PD-1, n = 23) and 3 independent experiments for the TGF-β1 treated groups (Isotype, n = 17; anti-PD-1, n = 17). The difference between plus and minus TGFβ groups (b) were modelled using log transformed data (see statistics section). c. Schematic showing identical setup as in a. but with activated E8i-CreERT2 TGFβRCAfl/+ Thy 1.1 + /1.2 + OT-I cells transferred into Thy1.2 + C57BL/6J recipients and no soluble TGF-β treatment was given (top). Tamoxifen was additionally administered on 6 consecutive days between days 0–5 of the engraftment period. LN and spleen OT-I cells were harvested on day 10 post-infection. Quantification of LN and spleen donor OT-I cells (log), LN OT-I CD44 + KLRG1-CD62L + TCM (log), spleen OT-I CD44 + KLRG1-CD62L + TCM (log) and CD44 + KLRG1-CD62L- TEM (log). Individual animals are shown (middle) and mean per experiment (bottom). Data were pooled from 3 independent experiments (Isotype, n = 13; anti-PD-1, n = 13). Statistics were estimated using a linear mixed-effects model with group by treatment interaction, anatomic site and phenotype when relevant, as fixed effects and a random intercept for each mouse or replicate. Bars and error bars show mean ± SEM. * p ≤ 0.05; ** p ≤ 0.01; *** p ≤ 0.001; **** p ≤ 0.0001. d. Summary showing role of PD-1 on specifying TRM formation.

References

    1. Gebhardt, T. & Mackay, L. K. Skin-resident memory T cells keep herpes simplex virus at bay. Immunol. Cell Biol.91, 441–442 (2013). - PubMed
    1. Liu, L. et al. Epidermal injury and infection during poxvirus immunization is crucial for the generation of highly protective T cell-mediated immunity. Nat. Med.16, 224–227 (2010). - PMC - PubMed
    1. Masopust, D. et al. Dynamic T cell migration program provides resident memory within intestinal epithelium. J. Exp. Med.207, 553–564 (2010). - PMC - PubMed
    1. Gaide, O. et al. Common clonal origin of central and resident memory T cells following skin immunization. Nat. Med.21, 647–653 (2015). - PMC - PubMed
    1. Jiang, X. et al. Skin infection generates non-migratory memory CD8+ TRM cells providing global skin immunity. Nature483, 227–231 (2012). - PMC - PubMed

Substances