

Mitochondrial genome of Bactrocera fruit flies (Tephritidae: Dacini): features, structure, and significance for diagnosis
- PMID: 40730955
- PMCID: PMC12309008
- DOI: 10.1186/s12864-025-11872-8
Mitochondrial genome of Bactrocera fruit flies (Tephritidae: Dacini): features, structure, and significance for diagnosis
Abstract
Background: True fruit flies (Diptera: Tephritidae) are among the most destructive pests of fruit and vegetables worldwide and are on the top of quarantine pest lists. To respond effectively to a fruit fly invasion, we need to identify the species rapidly and reliably to understand its biological features and guide response decisions. Molecular techniques have been used to improve the diagnostic ability circumventing many difficulties of morphological identification. However, the commonly used Cytochrome Oxidase I (COI) gene lacks sufficient variation to distinguish species within Bactrocera species complexes. Here we conducted mitochondrial genome sequencing to identify additional genetic markers that could aid diagnosis of Bactrocera fruit fly species.
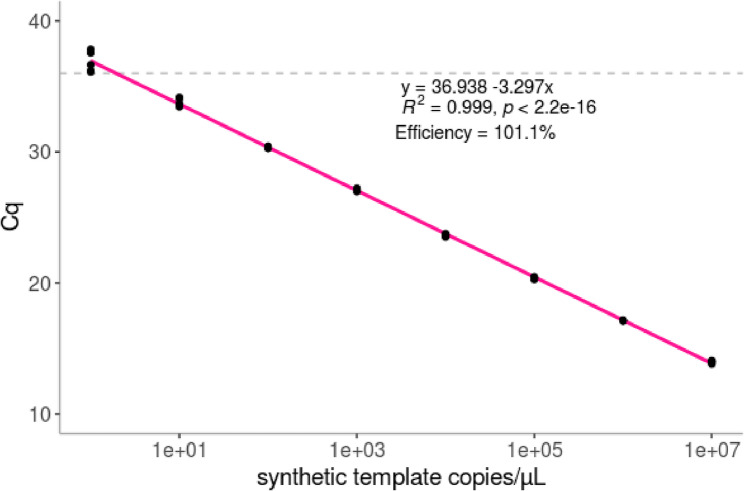
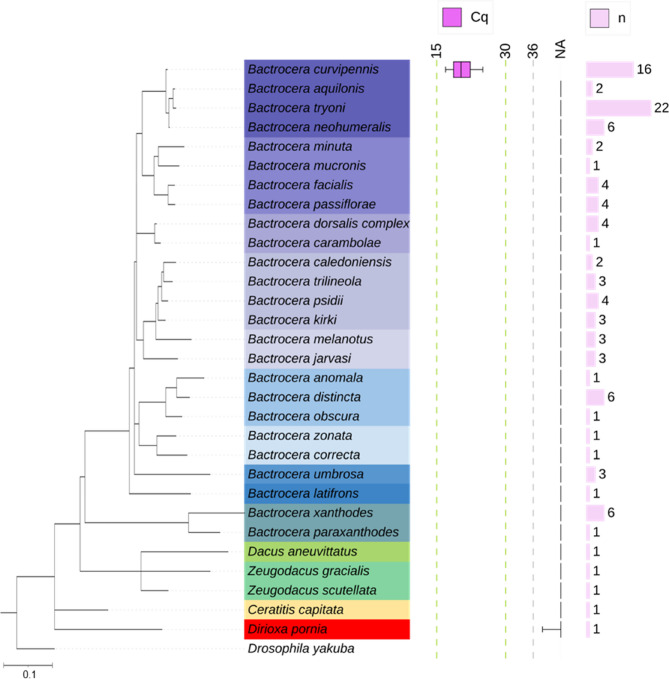
Results: We assembled 82 complete mitochondrial genomes from 16 Bactrocera species, including 13 species for which no mitochondrial genome data were previously available, as well as one species each from Dacus aneuvittatus, Dirioxa pornia and Zeugodacus gracilis. Phylogenetic analysis of the Tephritidae family confirmed the monophyly of the Bactrocera genus but could not properly resolve species within species complexes. Comparative mitochondrial genome analysis revealed that intergenic spacer and NADH dehydrogenase genes, specifically ND2 and ND6, harbour enough variations for new specific real-time PCR assays. Based on these findings, six TaqMan-based real-time PCR assays targeting ND2, COI, and CO3 genes were successfully designed and assessed for their specificity and sensitivity in detecting Bactrocera curvipennis, a member of the B. tryoni complex. Of these, one real-time PCR assay targeting the ND2 gene proved to be the most specific and sensitive. It detects B. curvipennis specifically at the level of 1 copy/µL of target DNA.
Conclusions: Mitochondrial sequence analysis and comparative studies indicate that mitochondrial genomes offer valuable genetic markers for accurate diagnosis of Bactrocera fruit flies. The successful development of the B. curvipennis real-time PCR assay highlights the importance of having additional genetic markers to advance the molecular diagnostics in economically important Bactrocera species.
Keywords: Bactrocera curvipennis; Biosecurity; DNA barcoding; Intergenic spacer; Molecular identification; Phylogeny; Species-specific real-time PCR.
© 2025. The Author(s).
Conflict of interest statement
Declarations. Ethics approval and consent to participate: No specific permits were required for all the sample collected for this study. No samples were collected in national parks and no endangered or threatened insects were included in this study, thus collection permits were not required for all the collections. All specimens imported into New Zealand were in accordance with the Import Health Standard, Sect. 22 of the Biosecurity Act 1993. Ethics approval was not required as insects are not classified as animals for the purposes of the Animal Welfare Act, 1999, New Zealand Legislation. Consent for publication: Not applicable. Competing interests: The authors declare no competing interests.
Figures


References
-
- Turbelin AJ, Cuthbert RN, Essl F, Haubrock PJ, Ricciardi A, Courchamp F. Biological invasions are as costly as natural hazards. Perspect Ecol Conserv. 2023;21:143–50.
-
- Papadopoulos NT, Meyer MD, Terblanche JS, Kriticos DJ. Fruit Flies: Challenges and Opportunities to Stem the Tide of Global Invasions. Ann Rev Entomol. 2024;69:355–73. - PubMed
-
- Trombik J, Ward SF, Norrbom AL, Liebhold AM. Global drivers of historical true fruit fly (Diptera: Tephritidae) invasions. J Pest Sci. 2023;96:345–57.
MeSH terms
Grants and funding
- 406793/Operational Research programme of the Ministry for Primary Industries (MPI), New Zealand
- 406793/Operational Research programme of the Ministry for Primary Industries (MPI), New Zealand
- 406793/Operational Research programme of the Ministry for Primary Industries (MPI), New Zealand
- 406793/Operational Research programme of the Ministry for Primary Industries (MPI), New Zealand
- 406793/Operational Research programme of the Ministry for Primary Industries (MPI), New Zealand
LinkOut - more resources
Full Text Sources
