. 2025 Jul 29;25(1):1239.
doi: 10.1186/s12885-025-14557-3.

A data assimilation framework for predicting the spatiotemporal response of high-grade gliomas to chemoradiation

Affiliations

A data assimilation framework for predicting the spatiotemporal response of high-grade gliomas to chemoradiation

Hugo J M Miniere et al. BMC Cancer. .

Abstract

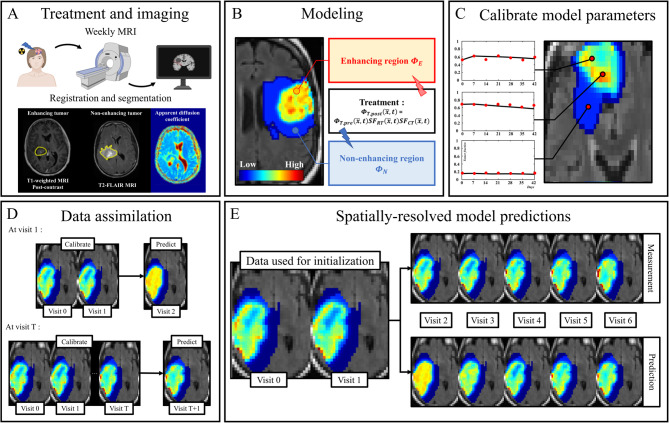
Background: High-grade gliomas are highly invasive and respond variably to chemoradiation. Accurate, patient-specific predictions of tumor response could enhance treatment planning. We present a novel computational platform that assimilates MRI data to continually predict spatiotemporal tumor changes during chemoradiotherapy.

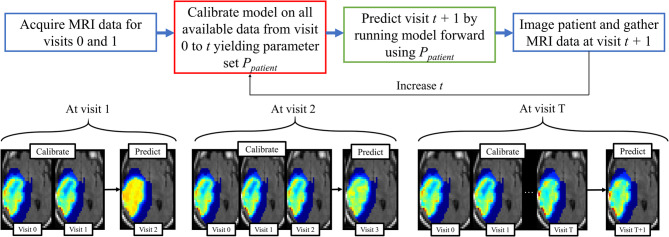
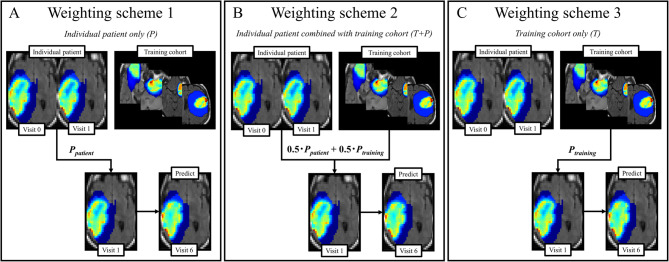
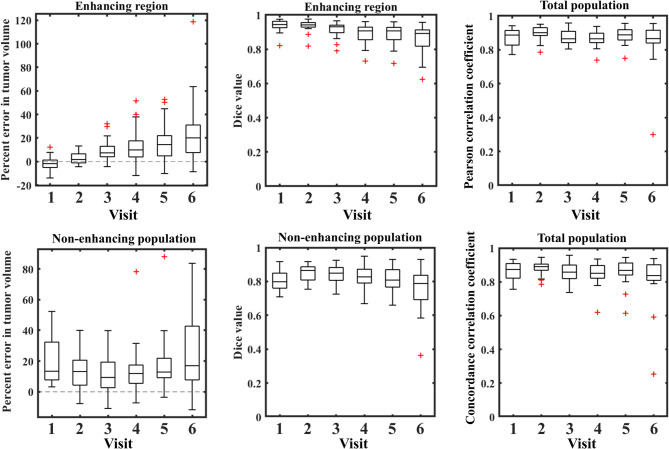
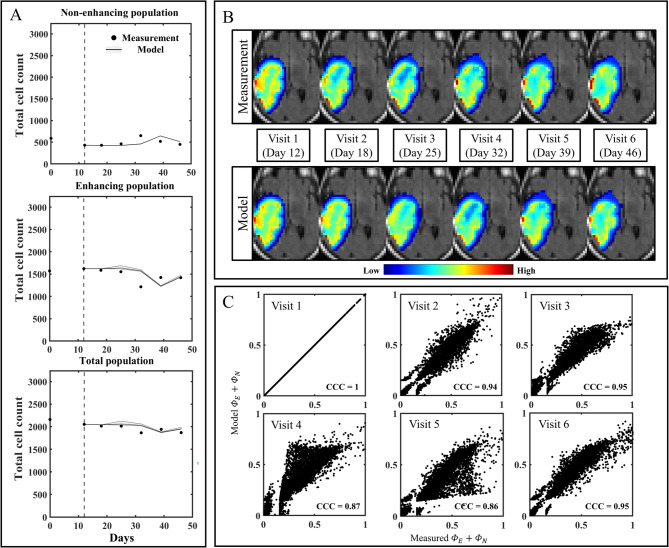
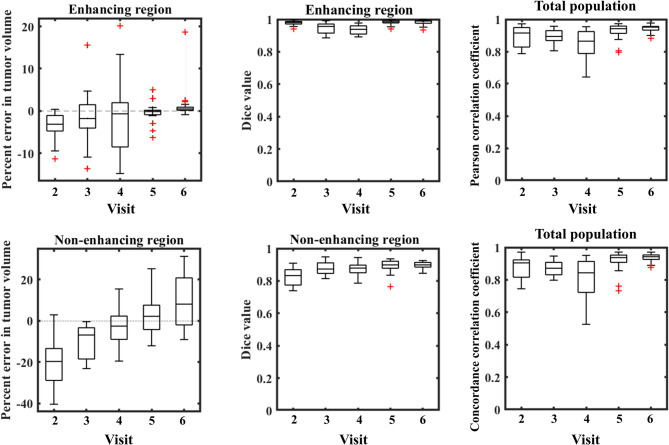
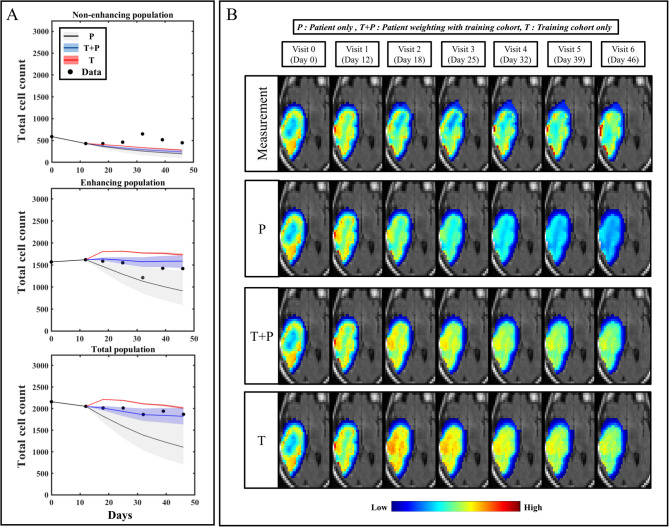
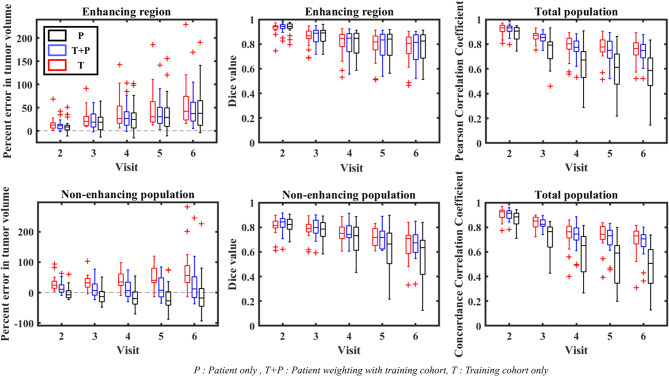
Methods: Tumor growth and response to chemoradiation was described using a two-species reaction-diffusion model of enhancing and non-enhancing regions of the tumor. Two evaluation scenarios were used to test the predictive accuracy of this model. In scenario 1, the model was calibrated on a patient-specific basis (n = 21) to weekly MRI data during the course of chemoradiotherapy. A data assimilation framework was used to update model parameters with each new imaging visit which were then used to update model predictions. In scenario 2, we evaluated the predictive accuracy of the model when fewer data points are available by calibrating the same model using only the first two imaging visits and then predicted tumor response at the remaining five weeks of treatment. We investigated three approaches to assign model parameters for scenario 2: (1) predictions using only parameters estimated by fitting the data obtained from an individual patient's first two imaging visits, (2) predictions made by averaging the patient-specific parameters with the cohort-derived parameters, and (3) predictions using only cohort-derived parameters.

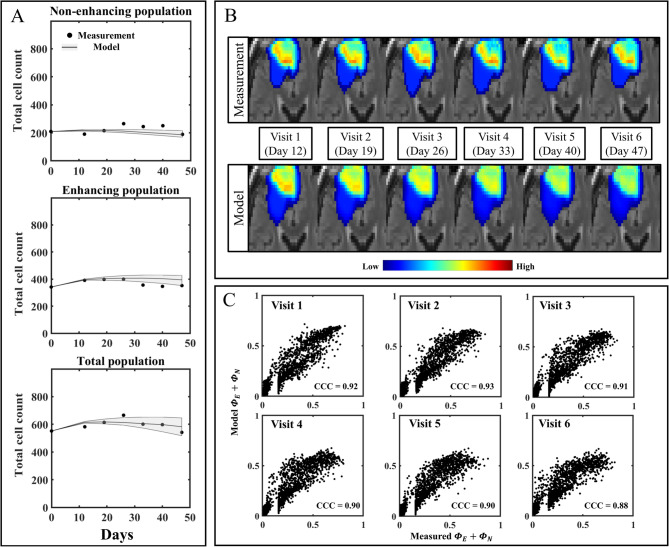
Results: Scenario 1 achieved a median [range] concordance correlation coefficient (CCC) between the predicted and measured total tumor cell counts of 0.91 [0.84, 0.95], and a median [range] percent error in tumor volume of -2.6% [-19.7, 8.0%], demonstrating strong agreement throughout the course of treatment. For scenario 2, the three approaches yielded CCCs of: (1) 0.65 [0.51, 0.88], (2) 0.74 [0.70, 0.91], (3) 0.76 [0.73, 0.92] with significant differences between the approach (1) that does not use the cohort parameters and the two approaches (2 and 3) that do.

Conclusions: The proposed data assimilation framework enhances the accuracy of tumor growth forecasts by integrating patient-specific and cohort-based data. These findings show a practical method for identifying more personalized treatment strategies in high-grade glioma patients.

Keywords: Computational oncology; Glioma; Imaging; Mathematical modeling; Personalized medicine.


Conflict of interest statement

Declarations. Ethics approval and consent to participate: All the patients involved in this study were enrolled on an institutional review board approved prospective study at M.D. Anderson Cancer Center (NCT# 04771806). All research methods adhered to the proper guidelines and regulations. Informed consent was collected from eligible patients that were enrolled into this trial. Consent for publication: Not applicable. Competing interests: The authors declare no competing interests.

Figures

Fig. 1
Fig. 1
Flowchart for predicting high-grade glioma using data assimilation. A HGG patients undergoing standard-of-care chemoradiation therapy are imaged using quantitative MRI techniques on a weekly basis (icons in top row obtained via BioRender). B A two-species model is used to characterize the spatio-temporal development of glioma tumors. C The model is calibrated using cell density maps, resulting in parameter values assigned to each individual voxel. D We use a data assimilation pipeline consisting of successive short-term predictions guided by serial measurements. E Successive visit-to-visit weekly predictions are performed to forecast the development of high-grade glioma tumors during chemoradiation therapy
Fig. 2
Fig. 2
Data assimilation pipeline for predicting glioma patients’ response to chemoradiotherapy (scenario 1). Predictions are performed on a weekly basis by calibrating the two-species model on data gathered from visit 0 to visit T, and then running the model forward from visit T using the calibrated parameters
Fig. 3
Fig. 3
Predicting patient response without weekly updates using three different weighting schemes (scenario 2). A This scenario does not leverage population-trained parameters. The model is calibrated on the first two visits of each individual patient yielding parameter set Ppatient, and then evaluated forward from visit 1 to visit 6. We refer to this scheme as “P” in the text. B In this scheme, the model is fully calibrated on the patient cohort (excluding the patient on which the prediction is being performed) from visit 0 to 6. The parameters are averaged into a parameter set Ptraining representing the patient cohort. This parameter set is averaged with the individually-calibrated parameters Ppatient, and the model is evaluated forward from visit 1. This scheme is referred to as scheme “T + P” indicating that both the population trained and individual patient parameter sets are employed for the prediction. C In this scheme, “T”, only the population-trained parameters are used to run the model forward on individual patients
Fig. 4
Fig. 4
Calibration of the two-species model on a representative HGG patient during chemoradiation treatment. A Measured bulk cell counts (black circles) are shown along with the model’s estimates for cell number within the non-enhancing, enhancing, and total population regions. B Comparison between measured (top row) and calibrated (bottom row) cell density maps on a central tumor slice. The model calibration recaptures the spatial patterns in both the non-enhancing and enhancing regions with robust agreement. C The model calibration shows strong agreement with the corresponding measured data at each time point with CCC scores greater than 0.88. Shaded areas correspond to the interquartile range of 100 forward model evaluations
Fig. 5
Fig. 5
Summary statistics of the model fits for the entire patient cohort. The percent error between the predicted and measured tumor volume is presented in the left column for both the enhancing (top) and non-enhancing (bottom) regions. A higher level of error was noted in the non-enhancing region compared to the enhancing region. The middle column shows the Dice values for the enhancing (top) and non-enhancing (bottom) regions. Overall, high levels of overlap were observed for both regions with median Dice values greater than 0.79. The third column shows the voxel-level error analysis for the PCC (top) and CCC (bottom). High levels of local agreement are seen for the entire time course for both metrics. Red crosses represent outlier values (i.e., outside of interquartile range)
Fig. 6
Fig. 6
Prediction of tumor development for patient 1 using a data assimilation pipeline (scenario 1). A Time-resolved predictions of cell count for the enhancing, non-enhancing, and total populations. Black dashed lines indicate visit 1 as the starting point from where predictions are initiated. B Comparison between the measured (top row) and predicted (bottom row) cell density maps for a central tumor slice at each time point. The main patterns of cell distribution are successfully captured using our proposed data assimilation pipeline. C The prediction obtained through data assimilation shows strong agreement with the corresponding measured data at each time point with CCC scores greater than 0.86. Shaded areas correspond to the interquartile range of 100 forward model evaluations
Fig. 7
Fig. 7
Summary statistics for predictions performed using the data assimilation pipeline (scenario 1). The percent error in tumor volume is presented in the left column for both the enhancing (top) and non-enhancing (bottom) regions. A higher level of error was noted in the non-enhancing region compared to the enhancing region. The middle column shows the Dice values for the enhancing (top) and non-enhancing (bottom) regions. High levels of agreement are seen for both regions, with better performances for the enhancing region, which show less changes in tumor volume over time. The third column shows the voxel-level error analysis for the PCC (top) and CCC (bottom). High levels of local agreement are seen for the entire time course for both metrics, with higher discrepancies observed at visit 4, corresponding to the second contrast agent injection. Red crosses represent outlier values (i.e., outside of interquartile range)
Fig. 8
Fig. 8
Prediction of tumor development for patient 1 without weekly updates (scenario 2). A Time-resolved predictions of cell count performed from Visit 1 for the three weighting schemes corresponding to Scenario 2. Scheme “P” (black) underestimates the cell count for both regions, while leveraging the training sets within schemes “T” and “T + P” (red and blue, respectively) slightly overestimate the enhancing cell count. The “T + P” scheme provides a robust prediction of the total cell count for this patient, as the discrepancy observed in the non-enhancing area compensates for that observed in the enhancing area. B Comparison of cell density maps for the central tumor slice obtained with each scheme of Scenario 2. Schemes “T” and “T + P” show strong agreement with the measured cell map, while scheme “P” demonstrates a decreasing cell density over time consistent with the observation made on panel A. Shaded areas correspond to the interquartile range of 100 forward model evaluations
Fig. 9
Fig. 9
Summary statistics for predictions performed without weekly updates for the three weighting schemes (scenario 2). In the enhancing region, the global metrics show no significant difference between the three weighting schemes, with increasing overestimation of the tumor volume over time and high Dice values greater than 0.80. Analysis on the non-enhancing population show that the “T” scheme overestimates the error in tumor volume, an observation consistent with the calibration error found in Fig. 5. While the “P” scheme underestimates this area, the “T + P” provides reliable predictions for the non-enhancing tumor volume. The Dice values for this area show that the “T + P” and “T” schemes outperform the “P” scheme. At the local level, the analysis shows that leveraging population trends clearly increases the quality of the predictions and provides higher values for both the CCC and PCC. Red crosses represent outlier values (i.e., outside of interquartile range)

Similar articles

References

    1. Stupp R, et al. Radiotherapy plus concomitant and adjuvant temozolomide for glioblastoma. N Engl J Med. 2005;352(10):987–96. - PubMed
    1. Aum DJ, et al. Molecular and cellular heterogeneity: the hallmark of glioblastoma. Neurosurg Focus. 2014;37(6):E11. - PubMed
    1. Omuro A. Glioblastoma and other malignant gliomas: a clinical review. JAMA. 2013;310(17):1842–50. - PubMed
    1. Ahmad SS, et al. Advances in radiotherapy. BMJ. 2012;345:e7765. - PubMed
    1. Nguyen D, et al. Feasibility of extreme dose escalation for glioblastoma multiforme using 4π radiotherapy. Radiat Oncol. 2014;9(1):239. - PMC - PubMed

LinkOut - more resources