. 2025 Jul 29;26(1):229.
doi: 10.1186/s13059-025-03689-1.

Artificial chromosome reorganization reveals high plasticity of the budding and fission yeast genomes

Affiliations

Artificial chromosome reorganization reveals high plasticity of the budding and fission yeast genomes

Xueting Zhu et al. Genome Biol. .

Abstract

Background: The genome of a eukaryotic cell is usually organized on a set of chromosomes. Recently, karyotype engineering has been applied to various organisms, but whether and to what extent a naturally evolved genome can resist or tolerate massive artificial manipulations remains unexplored.

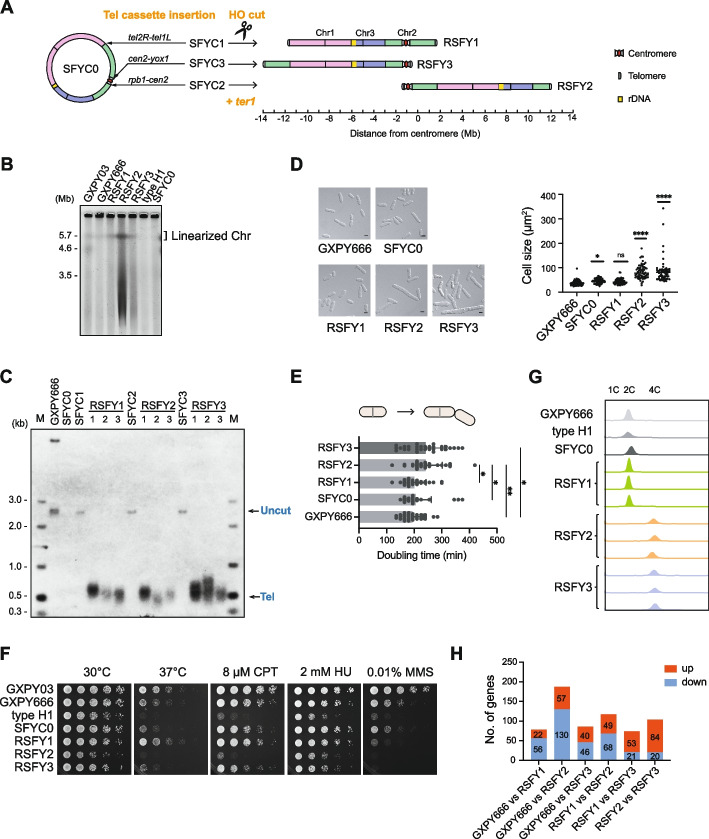
Results: Using unicellular yeast models of both Saccharomyces cerevisiae and Schizosaccharomyces pombe, we deliberately construct dozens of single-chromosome strains with different chromosome architectures. Three S. cerevisiae strains have the individual chromosomes fused into a single chromosome, but with the individual chromosomes in different orders. Eighteen S. cerevisiae strains have a single chromosome but with different centromeric sequences. Fifteen S. cerevisiae strains have a single chromosome with the centromere at different distances relative to the telomeres. Two S. pombe strains have a single, circular chromosome, and three strains have a single, linear chromosome with the centromere at different distances relative to the telomeres. All of these single-chromosome strains are viable, but the strains with an acrocentric or a telocentric chromosome have abnormal cell morphologies, and grow more slowly than those with a metacentric or sub-metacentric chromosome, and show increased genome instability with chromosome segregation abnormalities or genome diploidization.

Conclusion: The functional genomes of both the evolutionarily distant yeasts S. cerevisiae and S. pombe are highly tolerant of diversified genome organizations. The phenotypic abnormalities and increased genome instability of the acrocentric/telocentric single-chromosome yeasts suggest that yeasts with metacentric chromosomes have an evolutionary advantage.

Keywords: Chromosome engineering; Genome plasticity; Single-chromosome yeast; Telocentric chromosome.


Conflict of interest statement

Declarations. Ethics approval and consent to participate: Ethical approval is not applicable for the study. Consent for publication: Not applicable. Competing interests: The authors declare that they have no competing interests.

Figures

Fig. 1
Fig. 1
Creation and characterization of SY13 derived S. cerevisiae strains containing a single chromosome. A Schematic diagram of chromosome fusion. The SY13 and SY14 strains were established in a previous study [13]; FSY1, FSY2, and FSY3 were constructed by fusing two chromosomes in SY13 in different orders/orientations. Each native chromosome is marked with a unique color; the oval dot in red represents the centromere; and the semicircle in dark blue represents the telomere. B PFGE analysis of chromosomes in the SY13, FSY1, FSY2, and FSY3 strains. SY14 is used as a control and wild-type S. pombe chromosomes are used as size markers. Signals indicated with an asterisk are likely to be “damaged chromosome(s)” during DNA electrophoresis. C Southern blotting analysis of telomeres in FSY strains. Genomic DNA extracted from indicated strains was digested with XhoI and hybridized with a telomere-specific probe. Each terminal restriction fragment of the corresponding chromosome(s) is indicated on the right. Asterisks on the right indicate non-specific signals. D Morphology of representative SY13, SY14, and FSY cells in logarithmic phase. Cells were cultured at 30 °C in YPD medium. DIC images are shown. Scale bar, 5 μm. Quantification of cell size (n = 60) for each strain is shown at the right, and the p-value (****p < 0.0001) is shown at the top of the strains. E Growth analysis of FSY cells. Cells were cultured at 30 °C in YPD medium. SY13 and SY14 were used as controls. Error bars represent the standard deviation (s.d.), n = 3. The p-value (****p < 0.0001) at the right of each strain shows the significance of difference in growth rate compared to strain SY14. F Doubling time of FSY cells. For each strain, n = 30, the significance of the difference between the strains is indicated on the right (**p < 0.01). G Serial dilution assays of FSY cells under various genotoxic stress. Cells were grown at 30 °C for 2 days. CPT, camptothecin; HU, hydroxyurea; MMS, methyl methanesulfonate. H Serial dilution assays of single-chromosome yeast cells with replaced centromere sequence under various genotoxic stress. Schematic of centromere replacement in SY14 is shown on the left. SY14CENX represents single-chromosome yeast in which CEN15 was replaced with the conserved ~ 120-bp core centromere sequence of a corresponding chromosome, SY14CENX+ represents single-chromosome yeast in which CEN15 was replaced with the core centromere sequence and its CDEIII-proximal 500-bp pericentromeric sequence. Each centromere was marked with a unique color. Cells were grown at 30 °C for 2 days
Fig. 2
Fig. 2
Generation and characterization of SY15 derived S. cerevisiae strains containing a metacentric single chromosome. A Schematic of circular chromosome structure in SY15 [19] and linear chromosome structures in LSY strains. The telomere cassette (see “Methods” for details) was inserted into individual gene free locus of Chr. VII or Chr. X (indicated on the right of circular chromosome of SY15). Genes flanking the inserted telomere cassette were labeled on top of the lines which indicate linearized single-chromosomes. Specific gRNA expression induced double-strand breaks, leading to chromosome linearization and generation of LSY1 to LSY7 strains with rearranged chromosome structures (shown on the right). B PFGE analysis of chromosomes in the LSY strains. SY14, SY15, and wild-type S. pombe were used as controls. Signals indicated with an asterisk are likely to be “damaged chromosome(s)” during DNA electrophoresis. C Southern blotting assay of telomeres in LSY strains. Genomic DNA extracted from indicated strains were digested with Eco130I (left panel) or XbaI/ClaI (right panel, except that genomic DNA of LSY1 was digested with NotI/ClaI), and hybridized with a telomere-specific probe. Asterisks on the right indicate non-specific signals, triangles marked uncharacterized signals. D Morphology of representative SY15, SY14, and LSY cells in logarithmic phase. Cells were cultured at 30 °C in YPD medium. DIC images are shown. Scale bar, 5 μm. Quantification cell size (n = 60) for each strain is shown at the right, and the p-value (**p < 0.01, ****p < 0.0001) is shown at the top of the strains (compared to the strain SY14). E Growth analysis of LSY cells. Cells were cultured at 30 °C in YPD medium. Error bars represent standard deviation (s.d.), n = 3. The p-value (*p < 0.05, **p < 0.01, ****p < 0.0001) indicated at the right side of strains showed the significance of difference in growth rate compared to strain SY14. F Doubling time of LSY cells. For each strain, n = 30, there are no statistically significant differences between the strains and SY14
Fig. 3
Fig. 3
Construction and characterization of S. cerevisiae strains containing acrocentric chromosome. A Schematic of circular chromosome structure in SY15 and acrocentric chromosome structures in LCSY strains. The telomere cassette was inserted into individual gene free locus of Chr. XII or XV (indicated on the right of circular chromosome of SY15). Genes flanking the inserted telomere cassette were labeled on top of the lines which indicate linearized single-chromosomes. Specific gRNA expression induced double-strand breaks, leading to chromosome linearization and generation of acrocentric chromosomes (shown on the right). B PFGE analysis of chromosomes in the LCSY strains. SY14, SY15, and wild-type S. pombe were used as controls. Signals indicated with an asterisk are likely to be “damaged chromosome(s)” during DNA electrophoresis. C Southern blotting assay of telomeres in LCSY strains. Genomic DNA extracted from indicated strains was digested with Eco130I (left panel) or XbaI/ClaI (right panel) and hybridized with a telomere-specific probe. Asterisks on the right indicate nonspecific signals. D Morphology of representative LCSY cells in logarithmic phase. Shown are DIC images. Scale bar, 5 μm. Quantified cell size of 60 cells from each strain were showed at the right side, and the p-value (****p < 0.0001) indicated at the top of the strains showed the significance of difference in cell size compared to the SY14 strain. E Growth analysis of LCSY cells. Error bars represent standard deviation (s.d.), n = 3. The p-value (***p < 0.001, ****p < 0.0001) indicated at the right side of strains showed the significance of difference in growth rate compared to the SY14 strain. F Doubling time of LCSY cells. For each strain, n = 30, the significance of the difference between the strains is indicated at right (*p < 0.05, ****p < 0.0001)
Fig. 4
Fig. 4
Lopsided chromosome arms in S. cerevisiae LCSY strains leads to chromosome segregation defects. A Serial dilution assays of LSY and LCSY strains under various genotoxic drugs stress. CPT, camptothecin; HU, hydroxyurea; MMS, methyl methanesulfonate. Cells were grown on YPD medium at 30 °C for 2 days. B FACS analysis of DNA content in both LSY and LCSY strains. Two or three independent clones of each strain were tested. SY15 and SY14 were used as controls. C Live-cell fluorescence images of chromosome segregation in LCSY8 strain. (a) shows cells with normal chromosome segregation, (b)–(f) show cells with chromosome segregation errors (highlighted by white arrows). Cells were collected in logarithmic and images were captured during mitosis. Chromosomes were marked by the histone protein Htb1 which was tagged with YFP. Scale bar, 5 μm. D Relative percentage of the cell population which showing impaired chromosome segregation. Grey, cells under normal mitosis; orange, cells with impaired chromosome segregation. The total number of cells counted from three individual image and is given at the top of each column
Fig. 5
Fig. 5
Genomic and transcriptomic analysis of LSY and LCSY cells. A Chromosome structure variations of LSY and LCSY cells compared to SY14 cells. SyRI was used to identify structural variations between two whole-genome assemblies. B Venn diagram showing the overlap of all identified SNVs and indels in LSY1, LSY4, LCSY7, and LCSY8 cells. C–F Volcano plots of differentially expressed genes. C SY14 vs LSY1; (D) LSY1 vs LCSY7; (E) LSY1 vs LCSY8; (F) LCSY7 vs LCSY8. Statistical significance of differentially expressed genes (DEGs) were defined using FDR ≤ 0.05 and fold change > 2. Grey dots show genes with no significant differences, significantly upregulated genes are shown on the right side, significant downregulated genes are shown on the left side, significantly differentially expressed genes located on rearranged chromosomes are highlighted with a specific color. G Common GO terms of the DEGs in LSY1 vs LCSY7 and LSY1 vs LCSY8. The color of the bubble represents the significance of enrichment result (FDR) and the size means the statistical significance of the enrichment. H Shared KEGG pathway enrichment analysis of the DEGs in LSY1 vs LCSY7 and LSY1 vs LCSY8. The color of the bubble represents the significance of enrichment result (qvalue) and the size means the statistical significance of the enrichment. (I) Heatmap of gene expressions associated with chromosome segregation GO term (GO:0007059)
Fig. 6
Fig. 6
Construction of S. pombe strains with a single circular chromosome. A Schematic of the generation of telomerase-null survivors from single-chromosome fission yeast GXPY666 (Chr3cΔ−2-1cΔ) strain [15]. Deletion of ter1 in GXPY666 results in chromosome circularization and survivor formation. Each native chromosome is marked with a unique color; red dot and grey trapezoid represent centromere; grey dot represents telomere; yellow box shows the location of rDNA. B PCR analysis of chromosome fusion junctions in ter1Δ survivors (top panel). The band amplified from htb1 was used as a positive control. Schematics of circular chromosomes and telomere fusions at H1 and H3 loci in the ter1Δ survivors (middle and bottom panels). The pink line indicates the right end of Chr1; the purple line indicates the left end of Chr3; and grey dot line indicates eroded chromosome ends. H1/H1’ and H3/H3’ are homology regions in each sub-telomeric region [34]. C PFGE-Southern blotting analysis of intact genome and chromosome fragments in type H1 and type H3 survivors. Chromosomes were digested with the restriction enzyme NotI and the fragments were separated by PFGE. A telomere-specific probe was used for Southern blotting hybridization. The single linear chromosome in GXPY666 (Chr3cΔ−2-1cΔ) was used as a control. D Serial dilution assays of type H1 and type H3 survivors. Three independent clones are shown for both type H1 and type H3 strains. Cells were grown under different conditions, including 37 °C and genotoxic drug stress (CPT, HU and MMS)
Fig. 7
Fig. 7
Construction and characterization of S. pombe strains with sub-metacentric and telocentric single chromosomes. A Schematic of construction of single linear chromosome in SFYC0 strain. The telomere cassette (see “Methods” for details) was inserted into individual gene-free locus of Chr2 (indicated on the right of the circular chromosome of SFYC0). Genes flanking the inserted telomere cassette were labeled above the lines. HO expression induces double-strand breaks, leading to chromosome linearization, while ter1 was simultaneously reinserted into its original locus, generating stable strains with rearranged chromosome structures, designated RSFY1, RSFY2, and RSFY3 (shown on the right). Each native chromosome is marked with a unique color; red dot and grey trapezoid represent centromere; grey dot represents telomere; yellow box shows the location of rDNA. B PFGE analysis of chromosomes in RSFY1, RSFY2, and RSFY3. SFYC0 cells and type H1 survivor with circular chromosomes were used as control. The wild-type S. pombe (GXPY03) chromosome were used as size markers. C Southern blotting analysis of telomeres in RSFY1, RSFY2, and RSFY3 strains. GXPY666 (single-chromosome Chr3cΔ−2-1cΔ), SFYC0 (circular chromosome), SFYC1, SFYC2, and SFYC3 (circular chromosome with inserted telomere cassette) were used as controls. “Uncut” indicates bands containing the entire telomere cassette, “Tel” marks newly formed telomeres in a single linear chromosome. D Cell morphology of RSFY1, RSFY2, and RSFY3 strains in logarithmic phase. Cells were cultured in YES medium. DIC images are shown. Scale bar, 5 μm. Quantification cell size (n = 60) for each strain is shown at the right, and the p-value (*p < 0.05, ****p < 0.0001) is shown at the top of the strains (compared to the strain GXPY666). E Doubling time of RSFY1, RSFY2, and RSFY3 cells. For each strain, n = 30, the significance of the difference between the strains is indicated at right (*p < 0.05, **p < 0.01). F Serial dilution assays of RSFY1, RSFY2, and RSFY3 under different conditions. Cells were grown with different treatments, including 37 °C and genotoxic drug stress (CPT, HU, and MMS). G FACS analysis of DNA content in RSFY1, RSFY2, and RSFY3 strains. Three independent clones from each strain were tested. GXPY666, type H1 and SFYC0 were used as controls. H Numbers of DEGs between single-chromosome fission yeast strains. Red, upregulated genes; blue, downregulated genes

Similar articles

References

    1. Uhler C, Shivashankar GV. Regulation of genome organization and gene expression by nuclear mechanotransduction. Nat Rev Mol Cell Biol. 2017;18:717–27. - PubMed
    1. Talbert PB, Henikoff S. What makes a centromere? Exp Cell Res. 2020;389:111895. - PubMed
    1. Senaratne AP, Cortes-Silva N, Drinnenberg IA. Evolution of holocentric chromosomes: drivers, diversity, and deterrents. Semin Cell Dev Biol. 2022;127:90–9. - PubMed
    1. Mandrioli M, Manicardi GC. Holocentric chromosomes. PLoS Genet. 2020;16:e1008918. - PMC - PubMed
    1. Wood V, Gwilliam R, Rajandream MA, Lyne M, Lyne R, Stewart A, Sgouros J, Peat N, Hayles J, Baker S, et al. The genome sequence of Schizosaccharomyces pombe. Nature. 2002;415:871–80. - PubMed

MeSH terms

LinkOut - more resources