

Anthocyanin accumulation, inflorescence dry weight and total cannabidiol content have different temperature optima in Cannabis sativa
- PMID: 40731014
- PMCID: PMC12309197
- DOI: 10.1186/s42238-025-00311-w
Anthocyanin accumulation, inflorescence dry weight and total cannabidiol content have different temperature optima in Cannabis sativa
Abstract
Background: Limited information exists on how temperature affects phytocannabinoids and anthocyanin accumulation and inflorescence dry weight yield in Cannabis sativa. Understanding how temperature influences these traits is essential for refining cultivation practices, meeting market demands, and developing novel cannabis cultivars with improved agronomic, medicinal, and aesthetic attributes.
Methods: In this study, a day-neutral inbred population with uniform expression of purple pigmentation on the leaves and flowers was used to explore how temperatures ranging from 0.5 to 22 °C impacts inflorescence dry weight, cannabidiol (CBD) percentage, and anthocyanin accumulation in cannabis. Data on inflorescence dry weight (g/plant), CBD (%), and anthocyanin concentration (mg∙L− 1) in the primary inflorescence of each plant were collected and analyzed.
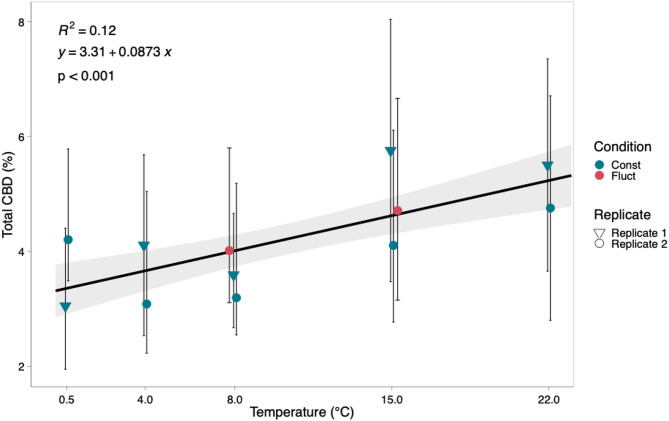
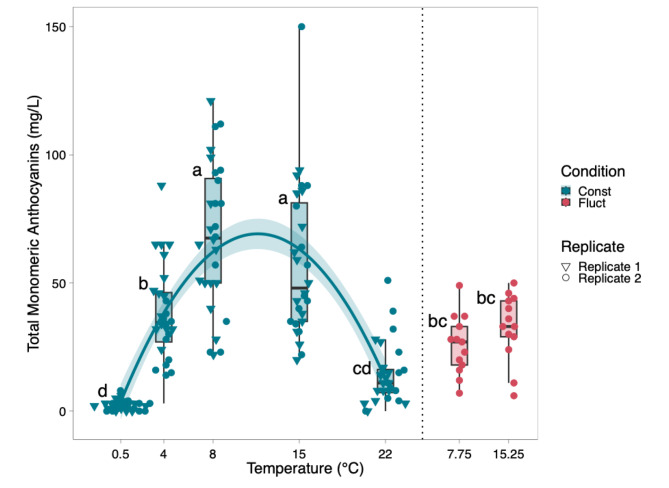
Results: Total CBD concentration and inflorescence dry weight yield increased with increasing temperature– likely a result of plant maturity rather than temperature stimuli. Anthocyanin accumulation was significantly affected by temperature stimuli, exhibiting peak production levels at constant temperatures of 8 °C and 15 °C.
Conclusions: CBD concentration and inflorescence dry weight predominantly correlate with plant maturity, whereas anthocyanin accumulation is responsive to variations in environmental temperature. Maximum anthocyanin levels at 8 °C and 15 °C, along with reduction at 0.5 °C and 22 °C, suggests distinct temperature-dependent regulatory pathways for anthocyanin biosynthesis in cannabis, separate from those influencing CBD biosynthesis and inflorescence dry weight. Modeling anthocyanin concentration, CBD concentration, and total inflorescence dry weight across various temperature treatments could optimize desired floral qualities and other traits associated with yield in cannabis.
Supplementary Information: The online version contains supplementary material available at 10.1186/s42238-025-00311-w.
Keywords: Anthocyanin; CBD; Cannabidiol; Cannabis; Temperature effects.
Conflict of interest statement
Declarations. Ethics approval and consent to participate: Not applicable. Consent for publication: Not applicable. Competing interests: The authors declare no competing interests.
Figures


References
-
- Akyüz FA, Ransom JK. Growing degree day calculation method comparison between two methods. in the Northern Edge of the US Corn Belt; 2015.
-
- Bassolino L, Zhang Y, Schoonbeek HJ, Kiferle C, Perata P, Martin C. Accumulation of anthocyanins in tomato skin extends shelf life. New Phytol. 2013;200(3):650–5. 10.1111/nph.12524. - PubMed
-
- Bates D, Mächler M, Bolker B, Walker S. Fitting linear Mixed-Effects models using lme4. J Stat Softw. 2015;67(1):1–48. 10.18637/jss.v067.i01.
LinkOut - more resources
Full Text Sources
