. 2025 Jul 29;58(1):53.
doi: 10.1186/s40659-025-00627-0.

Variations in flanking or less conserved positions of Reb1 and Abf1 consensus binding sites lead to major changes in their ability to modulate nucleosome sliding activity

Affiliations

Variations in flanking or less conserved positions of Reb1 and Abf1 consensus binding sites lead to major changes in their ability to modulate nucleosome sliding activity

Fernanda Raiqueo et al. Biol Res. .

Abstract

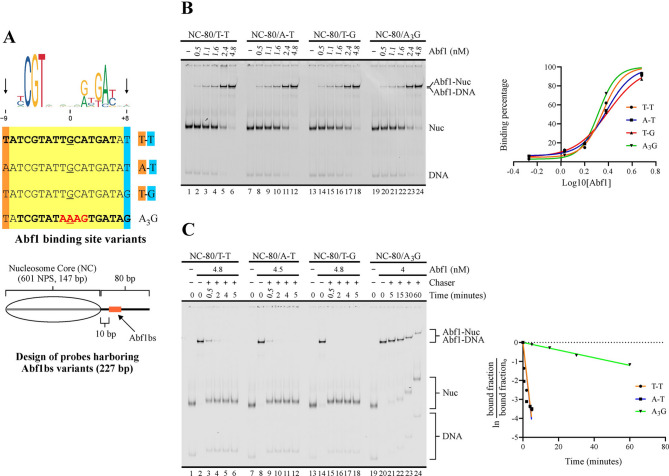
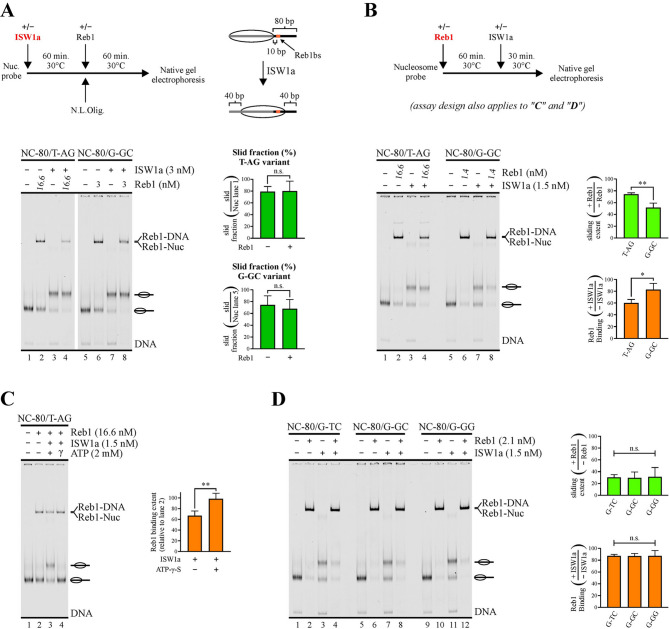
Background: Maintenance of nucleosome-free regions at gene regulatory regions conform a relevant aspect within chromatin dynamics. In the yeast Saccharomyces cerevisiae, Reb1 and Abf1 are among the transcriptions factors that perform this molecular function. These factors are thought to act as a barrier to nucleosome sliding that chromatin remodeling complexes such as ISW1a perform towards this region, being binding affinity a critical feature to act as a barrier. In this regard, sequence variations at positions flanking transcription factor binding sites could affect DNA shape features and, in turn, binding strength. In addition, recent studies have shown that positions of low conservation and/or flanking sequences might vary from gene bodies to gene regulatory regions. Considering these issues, we aimed to analyze whether variations in flanking or less conserved positions of Reb1 and Abf1 target sequences affect their binding affinity, especially dwell time, and their ability to hinder ISW1a's sliding activity.

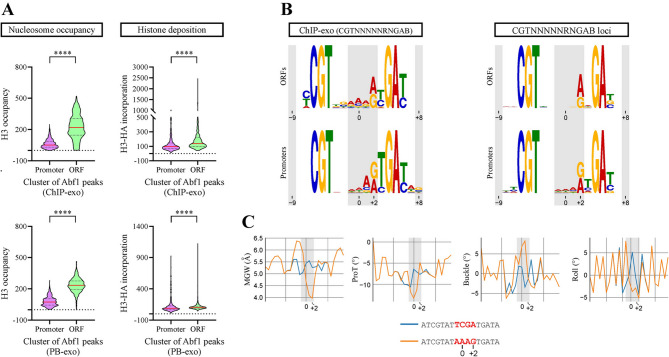
Results: We found that sequence changes at these positions deeply affect binding strength, particularly dwell time, and the ability to hinder ISW1a's sliding activity. Importantly, even under conditions where a markedly higher transcription factor concentration for a weak binding site was used to compare it to a strong binding site under an equal binding saturation level, the strong site displayed a significantly higher ability to hinder sliding activity. Moreover, genome-wide analyses showed that the sequence variants of Reb1 and Abf1 binding sites conferring this ability to hinder sliding activity to these factors are enriched at promoter regions relative to gene bodies.

Conclusions: Our findings show that dwell time is a key feature to hinder nucleosome sliding activity. For Reb1 and Abf1 factors, sequence variation at less conserved positions of their binding sites strongly affects this feature. The differential frequency at these positions found at promoter regions, relative to gene bodies, highlights the relevance of including this type of comparison in certain strategies used to determine the consensus binding site for transcription factors. To determine the molecular functions that require long dwell times and the transcription factors responsible for these tasks will significantly contribute to untangle the grammar of cis-regulatory elements.

Keywords: Abf1; Chromatin dynamics; Chromatin remodeling; Dwell time; ISW1a; Nucleosome remodeling; Nucleosome sliding; Reb1; Residence time; TFBS motifs.


Conflict of interest statement

Declarations. Ethics approval and consent to participate: Not applicable. Consent for publication: Not applicable. Competing interests: The authors declare that they have no competing interests.

Figures

Fig. 1
Fig. 1
Variations at flanking or less conserved positions of Reb1 consensus binding sites involve major changes in affinity and dwell time. (A) Upper panel: Depiction of Reb1 binding site variants tested. The name of each variant is based on the specific nucleotides present at positions −4, +4 and +5. Displayed on top is the consensus binding site, according to the JASPAR database [18]. Lower panel: Schematic representation of the nucleosome probes used in the assays. 601 NPS = nucleosome positioning region of the 601 sequence (gray bar). The oval represents the translational position adopted by the nucleosome core upon reconstitution, which spans the 601 region. Probe names indicate length of linker downstream (right) of the core and binding site variant located in the linker DNA region. (B, C) Apparent Kd (B) and dissociation kinetics (C) determinations for Reb1BS variants. The gel images correspond to electrophoresis in a non-denaturing polyacrylamide gel; each one is representative of three independent assays. The probe used in each reaction and Reb1 concentrations are depicted at the top of gel images; migrations of free DNA probe (DNA), nucleosome probe (Nuc), DNA probe bound by Reb1 (Reb1-DNA) and nucleosome probe bound by Reb1 (Reb1-Nuc) are indicated at the right. In addition, for the dissociation kinetics analysis, the different time points and use of an unlabeled double-stranded oligonucleotide harboring a Reb1BS for Reb1 removal (chaser) are depicted at the top of the gel image. The graphs at the right of each gel image correspond to densitometric quantification of binding percentages used to calculate Kd (B) and Koff (C) values, which are displayed in Table 1
Fig. 2
Fig. 2
Variations at less conserved positions of Abf1 consensus binding sites involve major changes in dwell time. (A) Upper panel: Depiction of Abf1 binding site variants tested. The name of each variant is based on the specific nucleotides present at positions −9 and +8 or present at positions −1 to +2 in the case of the A3G variant. Displayed on top is the consensus binding site, according to the JASPAR database [18]. Lower panel: Schematic representation of the nucleosome probes used in the assays. 601 NPS = nucleosome positioning region of the 601 sequence (gray bar). The oval represents the translational position adopted by the nucleosome core upon reconstitution, which spans the 601 region. Probe names indicate length of linker downstream (right) of the core and binding site variant located in the linker DNA region. (B, C) Apparent Kd (B) and dissociation kinetics (C) determinations for Abf1BS variants. The gel images correspond to electrophoresis in a non-denaturing polyacrylamide gel; each one is representative of three independent assays. The probe used in each reaction and Abf1 concentrations are depicted at the top of gel images; migrations of free DNA probe (DNA), nucleosome probe (Nuc), DNA probe bound by Abf1 (Abf1-DNA) and nucleosome probe bound by Abf1 (Abf1-Nuc) are indicated at the right. In addition, for the dissociation kinetics analysis, the different time points and use of an unlabeled double-stranded oligonucleotide harboring an Abf1BS for Abf1 removal (chaser) are depicted at the top of the gel image. The graphs at the right of each gel image correspond to densitometric quantification of binding percentages used to calculate Kd (B) and Koff (C) values, which are displayed in Table 2
Fig. 3
Fig. 3
Binding site variants featuring long dwell times endow Reb1 with the ability to hinder ISW1a’s sliding activity. (A-D) Nucleosome sliding assays performed for the set of probes harboring Reb1BS variants (see Fig. 1A and its legend for a detailed description of the variants tested and probes design). The gel images correspond to electrophoresis in a non-denaturing polyacrylamide gel and each one is representative of three (A, B, D) or four (C) independent assays. The probe used in each reaction, presence of Reb1, ISW1a, ATP and ATP-γ-S, as well as Reb1 concentrations, are depicted at the top of gel images; migrations of free DNA probe (DNA), DNA probe bound by Reb1 (Reb1-DNA) and nucleosome probe bound by Reb1 (Reb1-Nuc) are indicated at the right, where slid and non-slid nucleosome probe populations are represented schematically. The graphs at the right of gel images correspond to determinations of sliding extent and percentage of Reb1 binding; all values used for these determinations were obtained from densitometric analyses of the corresponding gel scans. Bars in the graphs display the average of three or four independent assays for each condition analyzed. Error bars represent one standard deviation. Asymmetric connectors between bars correspond to two-tailed unpaired t-tests, while symmetric connectors correspond to ANOVA with Tukey’s multiple comparisons tests. Asterisks denote statistically significant differences (* p < 0.05; ** p < 0.01); n.s. = non-significant difference. (A) Analysis of Reb1 binding to T-AG and G-GC nucleosome probe variants after nucleosome sliding mediated by ISW1a. Upper left: outline of the steps involved in the assay; N.L.Olig. = non-labeled oligonucleosomes, used for ISW1a removal after nucleosome sliding mediated by this complex. Upper right: Schematic representation of the translational position of the Reb1 binding site resulting upon nucleosome sliding mediated by ISW1a. (B) Analysis of ISW1a’s sliding activity and Reb1 binding to T-AG and G-GC nucleosome probe variants, where ISW1a was added to the reactions after incubation with Reb1. Upper panel: outline of the steps involved in the assay. (C) Analysis of the effect of ISW1a action on Reb1 binding in the presence of ATP or ATP-γ-S. See outline in (B) for the steps involved in the assay. (D) Analysis of ISW1a’s sliding activity and Reb1 binding to Reb1BS variants displaying long dwell times (G-TC, G-GC and G-GG), where ISW1a was added to the reactions after incubation with Reb1. See outline in (B) for the steps involved in the assay. Direct measures of sliding extent and Reb1 binding percentage are presented in Figs. S3 and S5
Fig. 4
Fig. 4
The binding site variant harboring the longest dwell time endow Abf1 with the strongest ability to hinder ISW1a’s sliding activity. (A-C) Nucleosome sliding assays performed for the set of probes harboring Abf1BS variants (see Fig. 2A and its legend for a detailed description of the variants tested and probes design). The gel images correspond to electrophoresis in a non-denaturing polyacrylamide gel and each one is representative of three independent assays. The probe used in each reaction, presence of Abf1 and ISW1a, as well as Abf1 concentrations, are depicted at the top of gel images; migrations of free DNA probe (DNA), DNA probe bound by Abf1 (Abf1-DNA) and nucleosome probe bound by Abf1 are indicated at the right, where slid and non-slid nucleosome probe populations are represented schematically. The graphs at the right of gel images correspond to direct measures of sliding activity (slid fraction, A and C), determinations of sliding extent in the presence of Abf1 relative to its absence or Abf1 binding upon ISW1a-mediated nucleosome sliding relative to its absence. All values used for these determinations were obtained from densitometric analyses of the corresponding gel scans. Bars in the graphs display the average of three independent assays for each condition analyzed. Error bars represent one standard deviation. Connectors between bars correspond to ANOVA with Tukey’s multiple comparisons tests, with asterisks denoting statistically significant differences (* p < 0.05; ** p < 0.01; *** p < 0.001). Additional analyses related to this figure are presented in Figs. S6, S7 and S8. (A) Analysis of Abf1 binding to the A3G nucleosome probe variant after nucleosome sliding mediated by ISW1a. Upper panel: outline of the steps involved in the assay; N.L.Olig. = non-labeled oligonucleosomes, used for ISW1a removal after nucleosome sliding mediated by this complex. Right panel: Schematic representation of the translational position of the Abf1 binding site resulting upon nucleosome sliding mediated by ISW1a. (B) Analysis of ISW1a’s sliding activity and Abf1 binding to Abf1BS variants, where ISW1a was added to the reactions after incubation with Abf1 and nucleosome sliding incubations were conducted for 60 min. (C) Time-course analysis, ranging from 5 to 30 min of the nucleosome remodeling incubation
Fig. 5
Fig. 5
Differential sequence frequency profiles and DNA shape features are reflected by Reb1 binding sites located at gene bodies relative to promoter regions. (A) Violin plots comparing the distribution of nucleosome occupancy (left panel) and histone deposition (right panel) levels for Reb1 binding sites located at gene bodies (ORFs) and promoter regions, according to in vitro (PB-exo) or in vivo determinations performed by Rossi and co-workers [11]. Nucleosome occupancy (histone H3) and histone deposition levels (H3-HA incorporation) were determined from genome-wide ChIP-seq data obtained by Kassem and co-workers [29]. Asterisks denote statistically significant differences (**** p < 0.0001), as deducted from the Mann-Whitney U test. (B) Consensus sequence exhibited by the same clusters of Reb1 binding site. The clusters were generated using the aforementioned ChIP-exo data, filtering by sites complying with the Reb1BS core sequence (TTACCCK) or, alternatively, by collecting the loci from ORFs or gene promoters harboring this Reb1BS core sequence. The logos of consensus binding sites were generated using the MEME suite [30]. Position probability matrices are reported in Tables S3 and S4. (C) DNA shape features predicted for the major transition of Reb1BS sequence pattern from gene bodies to promoter regions, using the Deep DNAshape webserver [32, 33]. The graphs correspond to the most significant differences found between the sequence patterns analyzed. ProT = propeller twist
Fig. 6
Fig. 6
Differential sequence frequency profiles and DNA shape features are reflected by Abf1 binding sites located at gene bodies relative to promoter regions. (A) Violin plots comparing the distribution of nucleosome occupancy (left panel) and histone deposition (right panel) levels for Abf1 binding sites located at gene bodies (ORFs) and promoter regions, according to in vitro (PB-exo) or in vivo determinations performed by Rossi and co-workers [11]. Nucleosome occupancy (histone H3) and histone deposition levels (H3-HA incorporation) were determined from genome-wide ChIP-seq data obtained by Kassem and co-workers [29]. Asterisks denote statistically significant differences (**** p < 0.0001), as deducted from the Mann-Whitney U test. (B) Consensus sequence exhibited by the same clusters of Abf1 binding site. The clusters were generated using the aforementioned ChIP-exo data, filtering by sites complying with the Abf1BS consensus sequence (CGTNNNNNRNGAB) or, alternatively, by collecting the loci from ORFs or gene promoters harboring this Abf1BS sequence. The logos of consensus binding sites were generated using the MEME suite [30]. Position probability matrices are reported in Tables S5 and S6. (C) DNA shape features predicted for the major transition of Abf1BS sequence pattern from gene bodies to promoter regions, using the Deep DNAshape webserver [32, 33]. The graphs correspond to the most significant differences found between the sequence patterns analyzed. ProT = propeller twist

Similar articles

References

    1. Lieleg C, Krietenstein N, Walker M, Korber P. Nucleosome positioning in yeasts: methods, maps, and mechanisms. Chromosoma. 2015;124(2):131–51. - PubMed
    1. Clapier CR. Sophisticated conversations between chromatin and chromatin remodelers, and dissonances in Cancer. Int J Mol Sci. 2021;22(11):5578. - PMC - PubMed
    1. Parnell TJ, Schlichter A, Wilson BG, Cairns BR. The chromatin remodelers RSC and ISW1 display functional and chromatin-based promoter antagonism. Elife. 2015;4:e06073. - PMC - PubMed
    1. Kubik S, Bruzzone MJ, Challal D, Dreos R, Mattarocci S, Bucher P, et al. Opposing chromatin remodelers control transcription initiation frequency and start site selection. Nat Struct Mol Biol. 2019;26(8):744–54. - PubMed
    1. Oberbeckmann E, Niebauer V, Watanabe S, Farnung L, Moldt M, Schmid A, et al. Ruler elements in chromatin remodelers set nucleosome array spacing and phasing. Nat Commun. 2021;12(1):3232. - PMC - PubMed

MeSH terms

LinkOut - more resources