Spatial assessment of heavy metal contamination in groundwater in the Kadaladi region, Tamil Nadu, India
- PMID: 40731043
- PMCID: PMC12307754
- DOI: 10.1038/s41598-025-12120-5
Spatial assessment of heavy metal contamination in groundwater in the Kadaladi region, Tamil Nadu, India
Abstract
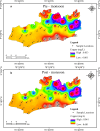
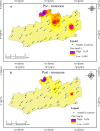
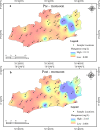
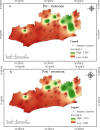
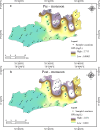
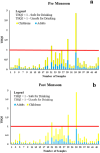
Groundwater quality in Kadaladi is a critical concern due to contamination from natural and human activities. This study assesses heavy metal concentrations across pre-monsoon and post-monsoon seasons at 44 sampling sites, using the Heavy Metal Pollution Index (HPI), Metal Index (MI), and non-carcinogenic risk (HQ) assessments. Key heavy metals analysed include Cu, Pb, Zn, Ni, Cd, Mn, and Fe, in Pre-monsoon and Post-monsoon with comparisons to WHO (2017) standards using atomic absorption spectrometry. The Heavy Metal Pollution Index (HPI) and Metal Index (MI) were computed to assess contamination levels, and health risks were evaluated through non-carcinogenic hazard quotient (HQ) models for adults and children. Results revealed that Mn and Fe concentrations exceeded WHO permissible limits in 20% of the samples, with Site 33 showing the highest pollution in HPI (99.1) and MI (17.89). Post-monsoon samples showed notably higher contamination, attributed to monsoonal leaching and runoff from agricultural and saltpan activities. GIS-based spatial analysis identified persistent hotspots at Sites 6, 24, and 33. Children were particularly vulnerable, with HQ values exceeding 2.0 in affected zones, especially due to Mn exposure. HQ values indicated that children face higher health risks, particularly from Mn, exceeding permissible limits in 4.55% of samples. Pearson correlation revealed strong Mn-Fe geogenic associations, while Cd-Mn correlations post-monsoon pointed to anthropogenic sources. The integration of spatial mapping using GIS and statistical methods provides insight into contamination hotspots, emphasizing the critical role of monsoonal hydrology in mobilizing pollutants. These findings underscore the need for region-specific mitigation strategies and regular water quality monitoring. The study fills a regional knowledge gap and contributes globally relevant insights on managing groundwater quality in vulnerable coastal systems.
Keywords: HPI; Health risk; Heavy metal; Kadaladi; Metal Index.
© 2025. The Author(s).
Conflict of interest statement
Declarations. Competing interests: The authors declare no competing interests. Ethics approval: The manuscript is conducted in the ethical manner advised by the targeted journal. Consent for publication: The research is scientifically consented to be published. Human face consent to publish the declaration: We have carefully reviewed all the images in our manuscript and confirm that no human faces are present.
Figures


Similar articles
-
Heavy metal pollution assessment of groundwater and associated health risks around the coal mining area, Singrauli, Madhya Pradesh, India.Environ Monit Assess. 2025 Jul 29;197(8):965. doi: 10.1007/s10661-025-14398-4. Environ Monit Assess. 2025. PMID: 40731175
-
Seasonal dynamics, sources, and health risks of trace and heavy metals in the tropical critical zone of the Western Ghats, India.Environ Geochem Health. 2025 Jul 31;47(9):349. doi: 10.1007/s10653-025-02658-8. Environ Geochem Health. 2025. PMID: 40742479
-
The prediction of heavy metal contamination in groundwater using machine learning algorithms: a case study from the Harran Plain, a major agricultural irrigation area in Türkiye.Environ Geochem Health. 2025 Jul 22;47(8):328. doi: 10.1007/s10653-025-02644-0. Environ Geochem Health. 2025. PMID: 40694221
-
Long-term trends in heavy metal contamination of marine sediments in the Arabian Gulf: A meta-analysis.Environ Monit Assess. 2025 Jul 8;197(8):873. doi: 10.1007/s10661-025-14348-0. Environ Monit Assess. 2025. PMID: 40627180 Free PMC article. Review.
-
Engaging One Health in Heavy Metal Pollution in Some Selected Nigerian Niger Delta Cities. A Systematic Review of Pervasiveness, Bioaccumulation and Subduing Environmental Health Challenges.Biol Trace Elem Res. 2024 Apr;202(4):1356-1389. doi: 10.1007/s12011-023-03762-5. Epub 2023 Jul 31. Biol Trace Elem Res. 2024. PMID: 37518840
References
-
- Egbueri, J. C. Groundwater quality assessment using pollution index of groundwater (PIG), ecological risk index (ERI) and hierarchical cluster analysis (HCA): A case study. Groundw. Sustain. Dev.10, 100292 (2020).
-
- Bhutiani, R., Kulkarni, D. B., Khanna, D. R. & Gautam, A. Water quality, pollution source apportionment and health risk assessment of heavy metals in groundwater of an industrial area in North India. Expo Health8, 3–18 (2016).
-
- Bhagure, G. R. & Mirgane, S. R. Heavy metal concentrations in groundwaters and soils of Thane Region of Maharashtra, India. Environ Monit. Assess.173, 643–652 (2011). - PubMed
-
- Sekhon, G. S. & Singh, B. Estimation of heavy metals in the groundwater of Patiala district of Punjab, India. Earth Resour.1, 1 (2013).
-
- Chidambaram, S., Karmegam, U., Prasanna, M. V. & Sasidhar, P. A study on evaluation of probable sources of heavy metal pollution in groundwater of Kalpakkam region, South India. Environmentalist32, 371–382 (2012).
MeSH terms
Substances
LinkOut - more resources
Full Text Sources
Miscellaneous

