. 2025 Jul 29;15(1):27713.
doi: 10.1038/s41598-025-12897-5.

Enabling scalable single-cell transcriptomic analysis through distributed computing with Apache spark

Affiliations

Enabling scalable single-cell transcriptomic analysis through distributed computing with Apache spark

Asif Adil et al. Sci Rep. .

Abstract

As the field of single-cell genomics continues to develop, the generation of large-scale scRNA-seq datasets has become more prevalent. Although these datasets offer tremendous potential for shedding light on the complex biology of individual cells, the sheer volume of data presents significant challenges for management and analysis. Off late, to address these challenges, a new discipline, known as "big single-cell data science," has emerged. Within this field, a variety of computational tools have been developed to facilitate the processing and interpretation of scRNA-seq data. However, several of these tools primarily focus on the analytical aspect and tend to overlook the burgeoning data deluge generated by scRNA-seq experiments. In this study, we try to address this challenge and present a novel parallel analytical framework, scSPARKL, that leverages the power of Apache Spark to enable the efficient analysis of single-cell transcriptomic data. scSPARKL is fortified by a rich set of staged algorithms developed to optimize the Apache Spark's work environment. The tool incorporates six key operations for dealing with single-cell Big Data, including data reshaping, data preprocessing, cell/gene filtering, data normalization, dimensionality reduction, and clustering. By utilizing Spark's unlimited scalability, fault tolerance, and parallelism, the tool enables researchers to rapidly and accurately analyze scRNA-seq datasets of any size. We demonstrate the utility of our framework and algorithms through a series of experiments on real-world scRNA-seq data. Overall, our results suggest that scSPARKL represents a powerful and flexible tool for the analysis of single-cell transcriptomic data, with broad applications across the fields of biology and medicine.

Keywords: Apache spark; Big data; Normalization; Quality control; ScRNA-seq.


Conflict of interest statement

Declarations. Competing interests: The authors declare no competing interests.

Figures

Fig. 1
Fig. 1
Apache Spark workflow. The Spark driver program works as a master and as an entry point for all the Spark jobs. The master submits jobs to the worker nodes. The cluster manager keeps the track of the nodes, and the jobs distributed to them, several cluster managers are Yet Another Resource Negotiator (YARN), Kubernettes, mesos and standalone (in our case). The worker/slave nodes are the actual machines where the tasks are executed, and they report back to the cluster manager.
Fig. 2
Fig. 2
General workflow of the scSPARKL pipeline. A complete, step-by-step description of each module is provided in the Materials and Methods section.
Fig. 3
Fig. 3
Histogram of Gene and cell qualities. (a) Mouse Brain cells and (b) Jurkat T932 cells. These are used for deciding the filtering thresholds, depending upon the nature of data as well as the biological question in hand.
Fig. 4
Fig. 4
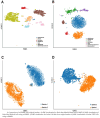
Comparison of scSPARKL with original studies. (a) tSNE projection for Brain Non-Myeloid data processed with SCANPY. (b) Corresponding tSNE visualization of Brain Non-Myeloid cells generated with scSPARKL. (c) Reference tSNE visualization for Jurkat Cell data from original author. (d) tSNE visualization of Jurkat-239T Cells using scSPARKL. Legends are shared for panels (a) and (b), and separately for panels (c) and (d).
Fig. 5
Fig. 5
Performance and Cluster evaluation. (a) Bar Plot representing the total time taken (in seconds) from submitting the job to the final output i.e., clustering, for different data with different cell loads. Cells were randomly sampled and chunked from 68 K-PBMC data. (b) ARI scores of Clustering results from Sequential Standalone scRNA pipeline and scSPARK. (c) Bar Plot depicting the time (in Milliseconds) taken by each process on different data sizes. All the processes shown in the plot are exclusively Spark based, running parallelly on each core.

Similar articles

References

    1. Wu, A. R., Wang, J., Streets, A. M. & Huang, Y. Single-Cell transcriptional analysis. Annual Rev. Anal. Chem.10 (1), 439–462. 10.1146/annurev-anchem-061516-045228 (2017). - PubMed
    1. Jindal, A., Gupta, P. & Sengupta, D. Discovery of rare cells from voluminous single cell expression data. Nat. Commun.10.1038/s41467-018-07234-6 (2018). - PMC - PubMed
    1. Slovin, S. et al. Single-Cell RNA sequencing analysis: A Step-by-Step overview. Methods Mol. Biology (Clifton N J). 2284, 343–365. 10.1007/978-1-0716-1307-8_19 (2021). - PubMed
    1. Vallejos, C. A., Marioni, J. C. & Richardson, S. BASiCS: Bayesian analysis of single-cell sequencing data. PLoS Comput. Biol.10.1371/journal.pcbi.1004333 (2015). - PMC - PubMed
    1. Wen, L. et al. Single-cell technologies: From research to application. Innovation10.1016/J.XINN.2022.100342 (2022). - PMC - PubMed

LinkOut - more resources