. 2025 Jul 29;8(1):1125.
doi: 10.1038/s42003-025-08556-0.

Paradise fish (Macropodus opercularis) as a complementary translational model for emotional and cognitive function

Affiliations

Paradise fish (Macropodus opercularis) as a complementary translational model for emotional and cognitive function

Zoltán K Varga et al. Commun Biol. .

Abstract

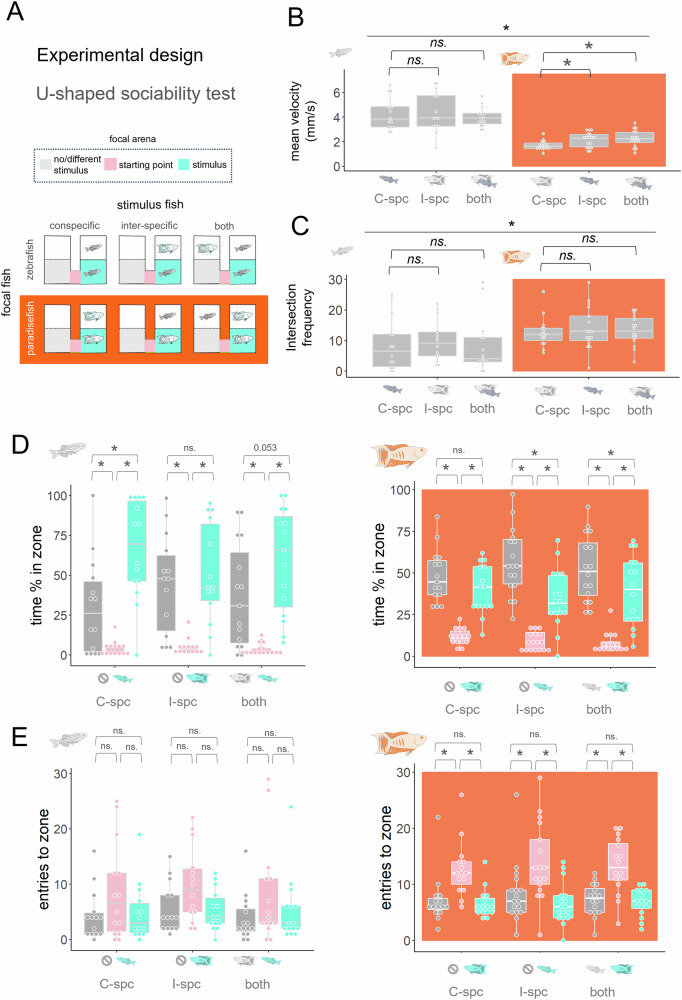
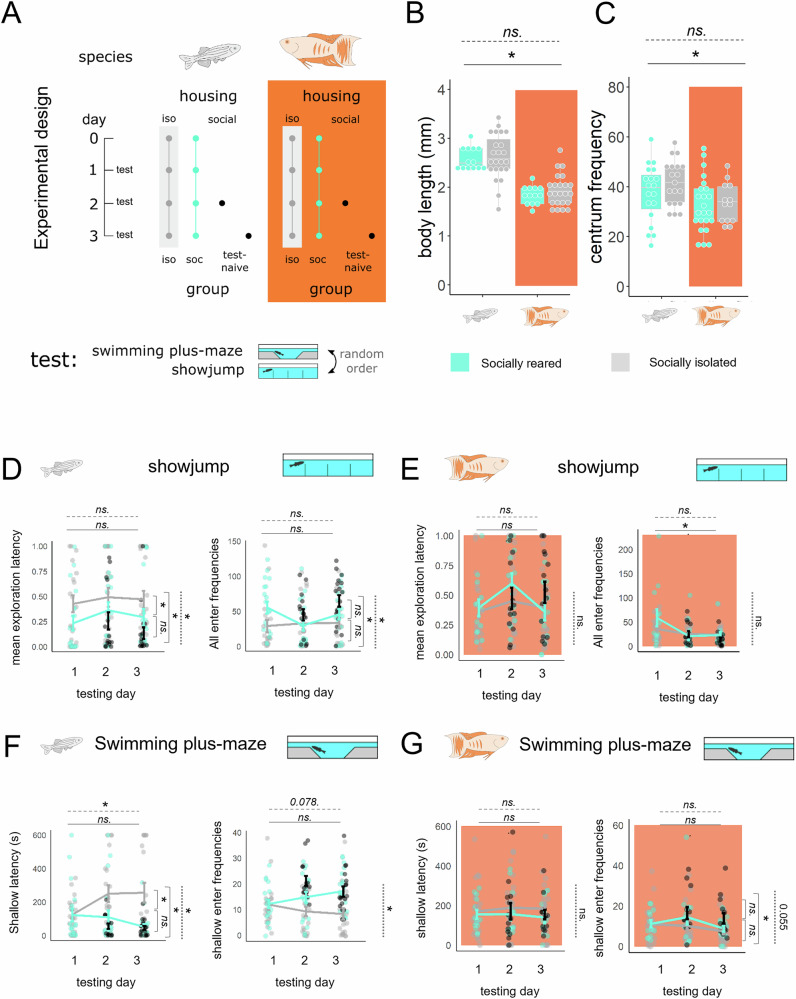
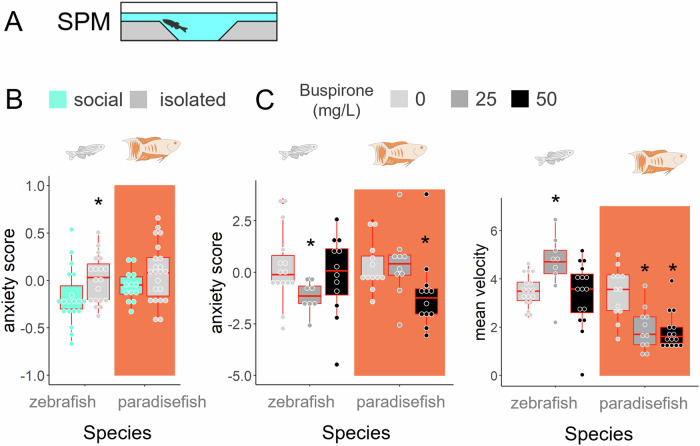
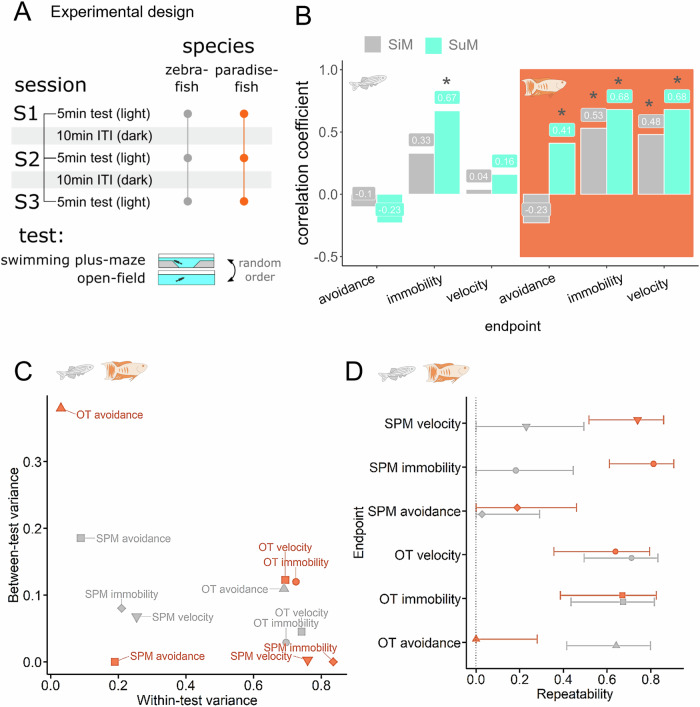
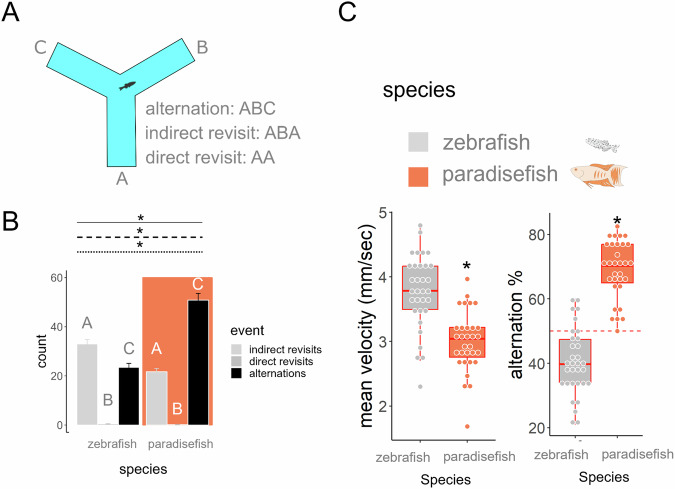
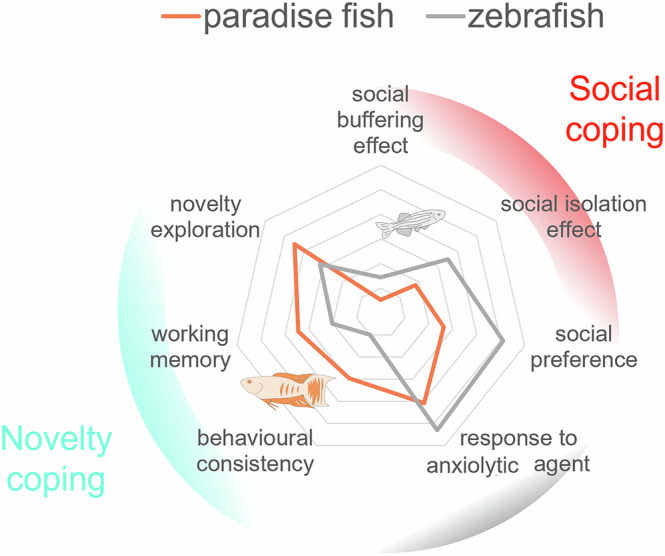
Zebrafish have revolutionised physiological screening in vertebrates, however, their strong sociality present challenges for interpreting behavioural assays conducted on individual subjects. To retain the advantages of the zebrafish model while addressing its limitations, we propose the use of a solitary species-the paradise fish-as a complementary model system. We compared paradise fish and zebrafish of late larval stage in social and non-social exploratory tasks, anxiety tests and in a working memory assay to assess their performance in these individual-based challenges. We found that in contrast to zebrafish, paradise fish did not show social approach in sociability tests, their exploratory behaviour was unaffected by the presence of a conspecific, and social isolation did not impair their performance during anxiety tests. Intra- and intertest variability measures of different anxiety tests revealed that, compared to zebrafish, paradise fish express more consistent, repeatable patterns of exploratory and risk-avoidance behaviour across time and contexts. We also showed that paradise fish exploration of the Y-maze is dominated by arm alternations, suggesting advanced working memory. Considering the results of this systematic comparison and the natural history of the two species we recommend prioritizing zebrafish in social tasks, while favouring paradise fish in individual-based behavioural assays.


Conflict of interest statement

Competing interests: The authors declare no competing interests.

Figures

Fig. 1
Fig. 1. Paradise fish show less direct social interactions compared to zebrafish.
A Experimental design of the intra-, inter-, and double-species challenges in which a conspecific (C-spc), an intraspecific (I-spc) or both are presented, respectively. 30 dpf focal subjects were put to the starting point/intersection (pink) of the focal arenas consisted of a no/different stimulus (grey) and a stimulus zones (turquoise). Following a fifteen-minute habituation period, stimulus subjects were placed next to the stimulus zones or next to the stimulus and the no/different stimulus zones in case of the double species challenge. B Mean velocity of swimming in the whole apparatus in response to each challenge presenting different stimulus fish. * on a solid line represents significant main effect of the species, * on bracket represent significant difference from the swimming velocity shown in the intra-specific challenge. C Entries to the starting point/intersection of the apparatus in response to each challenge presenting different stimulus fish. * on a solid line represents significant main effect of the species, * on bracket represent significant difference from the swimming velocity shown in the intra-specific challenge. D Percentage of time spent in the no/different stimulus (grey), the starting point/intersection (pink) or the stimulus zones (turquoise) in zebrafish (left) or paradise fish (right). * on brackets represents significant differences between time spent in the different zones. E Enter frequencies to the no/different stimulus (grey), the starting point/intersection (pink) or the stimulus zones (turquoise) in zebrafish (left) or paradise fish (right). * on brackets represents significant differences between time spent in the different zones.
Fig. 2
Fig. 2. Influence of conspecifics on exploratory behaviour.
A Experimental design of an exploration challenge using early (8 dpf) and late (30 dpf) larval zebrafish or paradise fish (species categories) applied alone or with a companion (group categories) to the slalom test. Colour code for the apparatuses matches the colour code of the plots. B Mean transition latency (scaled and averaged entry latencies to each chamber) of subjects. # represents significant main effect of the species category, * represents significant difference between group categories. C Percentage of the animals that reached the last chamber in a 10 min long session. D Distribution of exploration latencies (histograms) and the probability of their uni-, bi-, or tri-modal nature. The highest BIC values show the most likely number of independent gaussian distributions that the total distribution may consist of.
Fig. 3
Fig. 3. The effect of social isolation on exploration.
A Experimental design: Zebrafish and paradise fish of late larval stage (27–30 dpf) were kept in isolation or in social groups for 4 consecutive days and their behaviour was monitored with the SPM and SJ tests. Additional test naïve controls were tested in each testing day to control for carry-over effects of repeated testing. B Body length of the two species in response to social isolation. * on solid line represents significant main effect of the species, * on dashed lines represents significant main effect of social isolation. C centrum enter frequencies in the SPM of the two species in response to social isolation. * on solid line represents significant main effect of the species, * on dashed lines represents significant main effect of social isolation. Mean exploration latency and all enter frequencies of zebrafish (D) and paradise fish (E) in the showjump test. Shallow arm latency and shallow arm enter frequencies of zebrafish (F) and paradise fish (G) in the swimming plus-maze test. Horizontal solid or dashed lines with asterisk represent significant main effect of testing day or significant interaction between testing days and groups, respectively. Vertical dashed lines with asterisk represent significant main effect of the groups. Vertical braces with asterisks or different letters indicate significant post-hoc contrast between groups or testing days, respectively.
Fig. 4
Fig. 4. Exploration variables as markers of anxiety.
A Zebrafish and paradise fish of late larval stage (30 dpf) were tested in the SPM test following social isolation stress or anxiolytic buspirone treatment. Anxiety scores were calculated from time and frequency data of shallow arm activity. B Shallow arm activity (anxiety-score) in response to 4 days of social isolation in zebrafish (white) and paradise fish (orange). C Shallow arm activity (anxiety-score) and mean velocity in response to buspirone in zebrafish and paradise fish. Asterisks represent significant post-hoc contrast from socially reared (social isolation) or vehicle treated (buspirone) groups following significant group main effect.
Fig. 5
Fig. 5. Behavioural consistency in contexts and time were investigated by conducting two type of anxiety tests (SPM and OT) in a repeated design measuring inter and intra-test variability, respectively.
A Design of the experiment. B Inter-test correlations between similar variables measured in the SPM and OT tests. Grey bars represent correlations between single measures (one test event) and turquoise bars represent correlations between summary measures of three consecutive test events. C Single measures of the species in the between-test-within-test variance space. D Repeatability scores of single measures and their confidence intervals were calculated from between-and within-test variability by parametric bootstrapping. Variables with a confidence interval crossing the 0 dotted line are not considered repeatable.
Fig. 6
Fig. 6. Exploration strategy of zebrafish and paradise fish of late larval stage (30 dpf).
A Schematic drawing of the y-maze platform and a list of the possible exploratory actions. B Distribution of different exploratory actions in zebrafish (white) and paradise fish (orange). Asterisks on a solid, dashed or dotted line represent significant main effect of species, action type or significant interaction between these, respectively. Different letters represent significant post-hoc contrasts. C mean swimming velocity and alternation % of the two species. Asterisks represent significant species differences. Red dashed line represents 50% alterations, meaning random choice in the y-maze test.
Fig. 7
Fig. 7. Comparison of zebrafish and paradise fish of late larval stage in several assays tracing out the possible fields of use of the two species.
Effect sizes were plotted in the case of social buffering effect (mean latency), social isolation effect (average effect size of the shallow frequency and shallow latency of the SPM, and the total frequency, and the mean latency of the SJ test), social preference effect (time spent in social zone), response to anxiolytic agent (anxiety score), and working memory (alternation%). These were calculated by the subtraction of group means and the division by the total standard deviation of those. The absolute values of effect sizes were plotted. Averages of the inter-test correlation coefficients of summary measures were plotted in the case of behavioural consistency. Success rate in the slalom test were plotted in the case of novelty exploration.

Similar articles

References

    1. Chen, Z.-Y. & Zhang, Y. Animal models of Alzheimer’s disease: applications, evaluation, and perspectives. Zool. Res.43, 1026–1040 (2022). - PMC - PubMed
    1. Negi, S., Kumar, S. & Singh, A. Preclinical in vivo drug development studies: limitations, model organisms, and techniques. in Drugs and a Methodological Compendium (eds. Rajput, V. S. & Runthala, A.) 149–171. 10.1007/978-981-19-7952-1_6 (Springer Nature, Singapore, 2023)
    1. Johan Arief, M. F., Choo, B. K. M., Yap, J. L., Kumari, Y. & Shaikh, M. F. A systematic review on non-mammalian models in epilepsy research. Front. Pharmacol.9, 387505 (2018). - PMC - PubMed
    1. Braems, E., Tziortzouda, P. & Van Den Bosch, L. Exploring the alternative: Fish, flies and worms as preclinical models for ALS. Neurosci. Lett.759, 136041 (2021). - PubMed
    1. Anderson, D. J. & Adolphs, R. A framework for studying emotions across phylogeny. Cell157, 187–200 (2014). - PMC - PubMed

LinkOut - more resources