Comparative Study
. 2025 Jul 29;15(1):27687.
doi: 10.1038/s41598-025-13588-x.

Comparative analysis of 3D-culture techniques for multicellular colorectal tumour spheroids and development of a novel SW48 3D-model

Affiliations
Comparative Study

Comparative analysis of 3D-culture techniques for multicellular colorectal tumour spheroids and development of a novel SW48 3D-model

Carlos Mateos-Sánchez et al. Sci Rep. .

Abstract

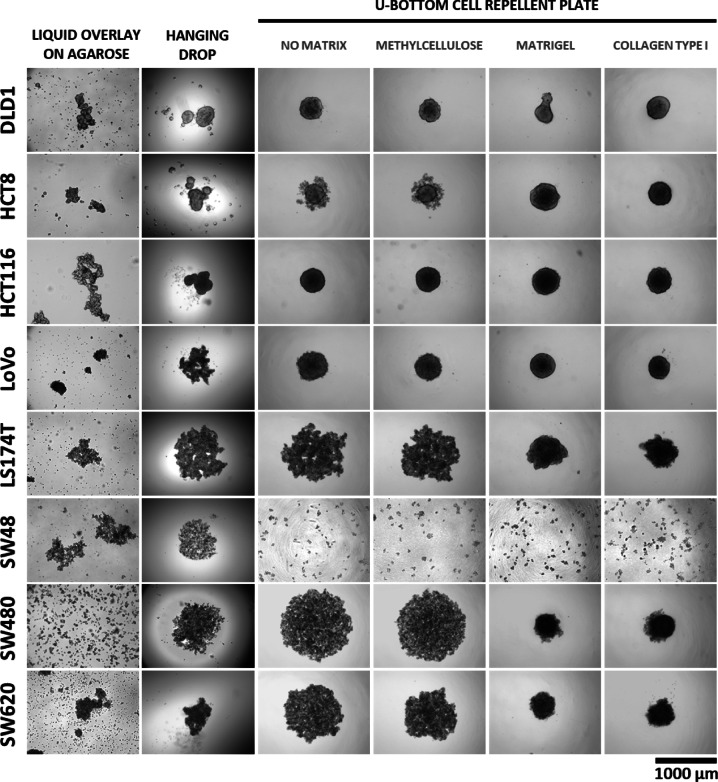
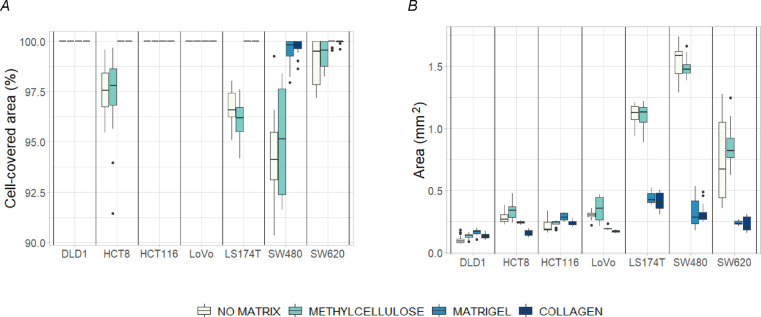
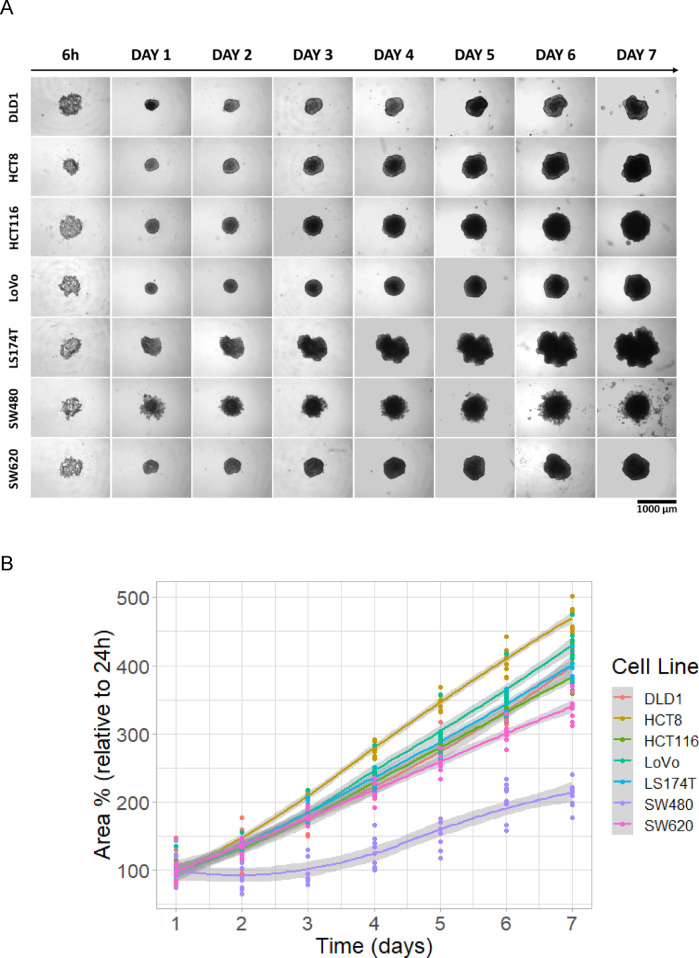
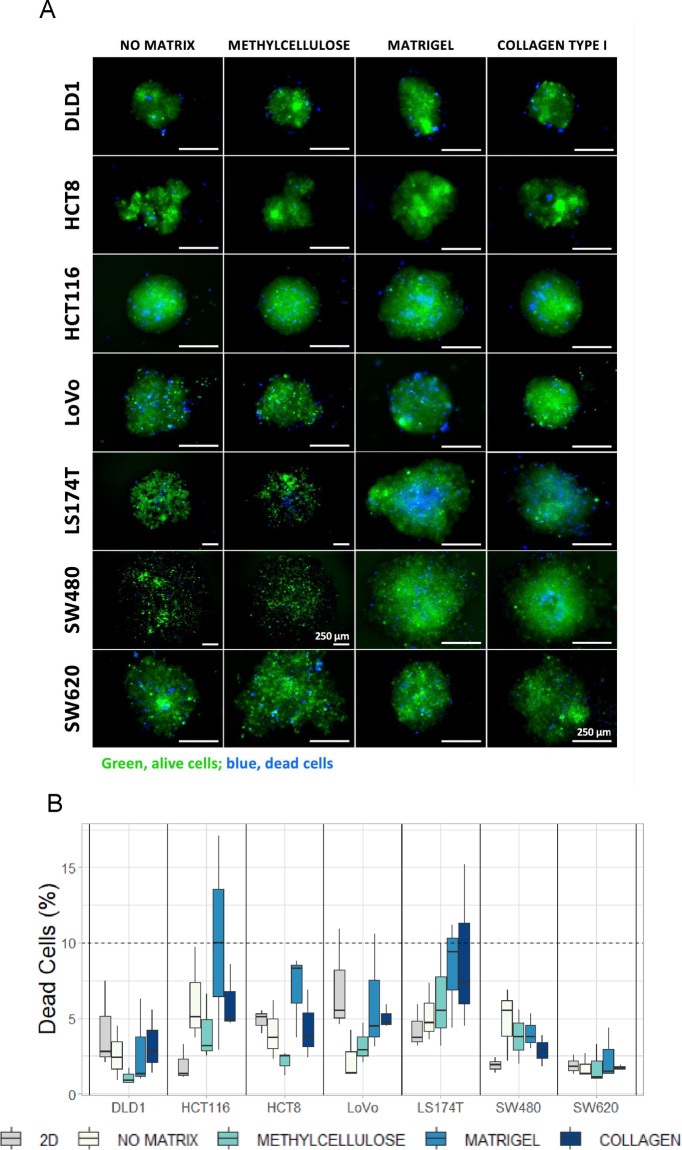
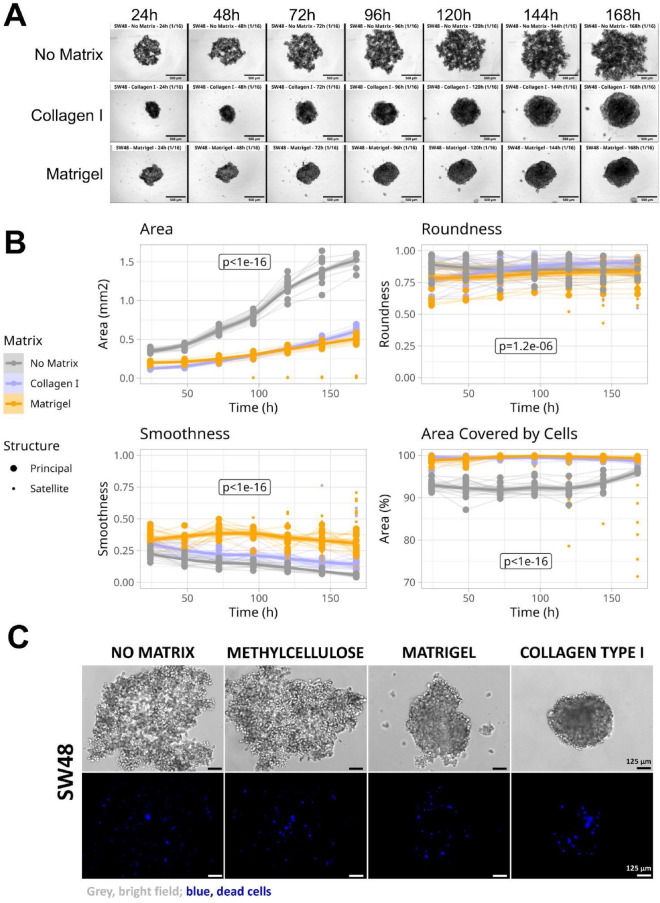
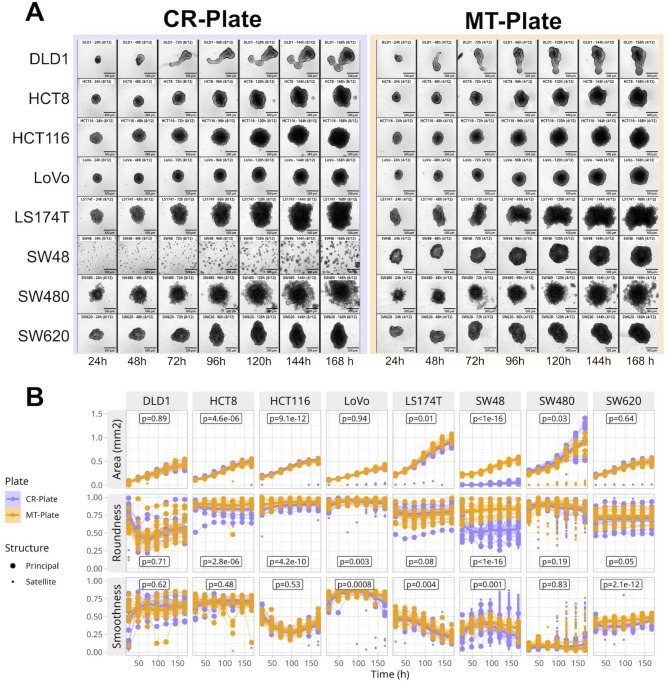
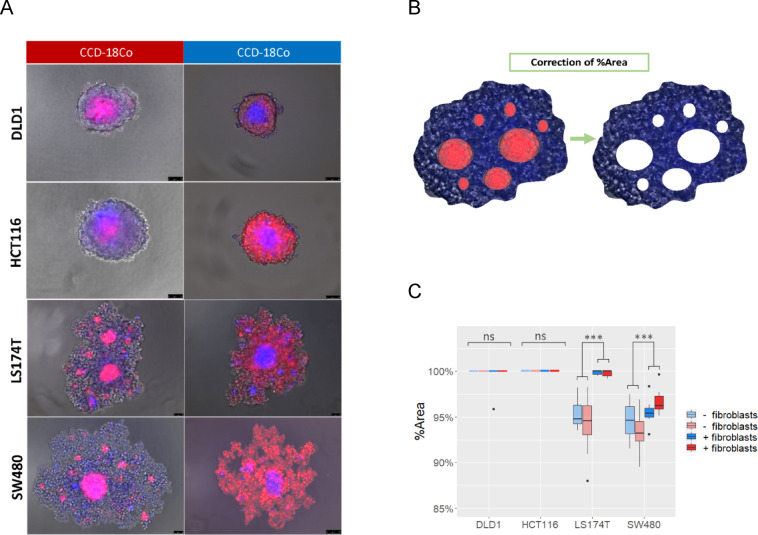
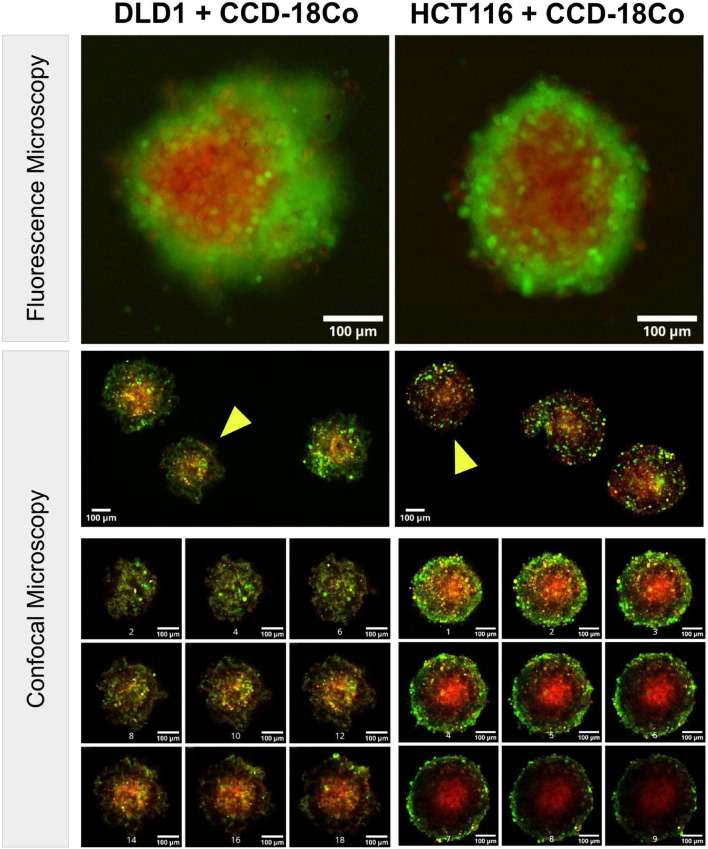
Colorectal cancer (CRC) is an important global health challenge, with nearly 2 million diagnosed cases and over 900,000 deaths annually despite therapeutic advancements. The high morbidity and mortality rates underscore the need for more efficient therapies. Three-dimensional (3D) cell culture models have emerged as more physiologically relevant alternatives to traditional two-dimensional (2D) models for drug screening and mechanistic studies. However, generating consistent spheroids across different CRC cell lines presents technical challenges, and protocols remain inconsistent. This study evaluated different 3D culture methodologies, i.e. overlay on agarose, hanging drop, and U-bottom plates without matrix or with methylcellulose, Matrigel or collagen type I hydrogels, across eight CRC cell lines. Multicellular tumour spheroids (MCTS) morphology and cell viability were analysed. Co-cultures with immortalised colonic fibroblasts were explored to improve the physiological relevance of the tumour models. The study provided insights into the morphological and viability characteristics of 3D cultures across multiple CRC cell lines. A novel compact spheroid model using the SW48 cell line was successfully developed. Co-culture experiments with fibroblasts offered additional insights into tumour-stroma interactions in a 3D setting. This study contributes to the advancement of more physiologically relevant in vitro CRC models, potentially enhancing the accuracy of preclinical studies and drug screening processes. The successful 3D model of SW48 expands the repertoire of CRC cell lines available for 3D culture studies. The treatment of regular multi-well plates with anti-adherence solution allows to generate CRC spheroids at significantly lower cost than using cell-repellent multi-well plates. These findings may lead to improved preclinical models for CRC research and drug development.

Keywords: Colorectal cancer 3D models; Tumour spheroids.


Conflict of interest statement

Declarations. Consent for publication: All authors have read and agreed to the published version of the manuscript. Competing interests: The authors declare no competing interests.

Figures

Fig. 1
Fig. 1
Representative images of CRC cell lines spheroids generated using different techniques and extracellular matrices. The cell lines tested were DLD1, HCT8, HCT116, LoVo, LS174T, SW48, SW480, and SW620. Cells were seeded at 105 cells/mL for liquid overlay on 1% (w/v) agarose, 3,000 cells in 30 µL drops for hanging drop, and 3,000 cells/well in U-bottom 96-well cell repellent plates. The concentrations of the different extracellular matrices were 2.5 mg/mL methylcellulose, 2.5% Matrigel, and 25 µg/mL collagen type I. All pictures were taken 72 h after cell seeding using a Leica DM6000B microscope with 4X objective.
Fig. 2
Fig. 2
Compactness analysis of CRC MCTS cultured on different matrices. 3,000 cells/well were seeded in U-bottom cell-repellent plates for 72 h. The concentration of the extracellular matrices were: 2.5 mg/mL methylcellulose, 2.5% Matrigel, and 25 µg/mL collagen type I. Left) Compactness measurements of the micrographs were performed using ImageJ software. Right) The area covered by the cells was calculated by the difference between the total spheroid area and the sum of the area of the holes. Statistical analyses were performed by two-way ANOVA including cell line and matrix type as independent explanatory variables, followed by Tukey’s HSD tests for pairwise comparisons. Deviation from normality was tested using Shapiro-Wilk’s test. The comparisons of Matrigel vs. no-matrix and Collagen type I vs. no-matrix were statistically significant for the cell-covered area and total area (in all cases p < 10− 6). The comparison between methylcellulose vs. no matrix was borderline significant for cell-covered area (p = 0.02) and not significant for total spheroid area (p = 0.79).
Fig. 3
Fig. 3
Long-term cultured of CRC spheroids. (A) Representative images of CRC spheroids cultured over a week. All cell lines were cultured in U-bottom 96-well cell repellent plates with 2.5% Matrigel. Cells were seeded at 3,000 cells/well. All pictures were taken using a LEICA DM6000B microscope with 4X objective. (B) CRC spheroid area measurements using Image J from micrographs taken over one week. Every time point represents data from 8 individual spheroids. The grey shaded areas indicate the 95% confidence intervals of the Locally Estimated Scatterplot Smoothing (loess).
Fig. 4
Fig. 4
Effect of culture matrix on MCTS cell viability. (A) Representative cell viability images of the CRC MCTS. Cells were stained with Cell Tracker Green CMFDA (1 µM) and seeded at 3,000 cells/well in U-bottom 96-well cell repellent plates. The concentrations of the extracellular matrices were 2.5 mg/mL methylcellulose, 2.5% Matrigel, and 25 µg/mL collagen type I. After 72 h, the MCTS were stained with DAPI to label dead cells, and pictures were taken using a Leica DM6000B microscope with 4X or 10X. (B) Cell viability quantification of the MCTS cultured in different matrices. Cells were stained at 72 h with Zombie Violet (BioLegend), and cell death was analysed by flow cytometry. Statistical analyses were done independently for every cell line, using one-way ANOVA with culture condition as explanatory variable followed by Tukey’s HSD tests for pairwise comparisons (n = 3 independent replicates per group of 12 spheroids each). No statistical significant differences were found between cell death rate in absence of matrix vs. any of the tested matrices, or between culturing the cells in 2D vs. 3D.
Fig. 5
Fig. 5
SW48 compact spheroid models. (A) Representative images of MCTS generated in MT-plates treated with an anti-adherence rinsing solution. Cells were seeded at 3,000 cells per well in different conditions: no matrix, 25 µg/mL collagen type I, and 2.5% Matrigel. Pictures were taken using a LEICA DM6000B microscope with 4X objective, and analysed using an automated ImageJ script (Supplementary Fig. 4.2). The complete set of pictures are provided in the Supplementary File TimeSeries.zip. (B) Morphological analysis of SW48 spheroids cultured with no matrix, collagen I or Matrigel. The addition of collagen I or Matrigel generated smaller, rounder, smoother and more compact SW48 spheroids. P-values indicate the statistical significance of the effect of the matrix after correcting for time (multivariate linear regression, with time and matrix as explanatory variables). (C) Viability evaluation by DAPI staining of SW48 spheroids cultured for 72 h in anti-adherence treated MT-plates in absence of matrix, or with 2.5 mg/mL methylcellulose, 25 µg/mL collagen type I, or 2.5% Matrigel. MCTS were stained with DAPI (1 µg/mL) to label dead cells. Pictures were taken using a LEICA DM6000B microscope with 10X objective.
Fig. 6
Fig. 6
Morphology of CRC MCTSs generated in CR-plates and anti-adherence treated MT-plates. (A) Representative images of MCTS from the 8 CRC cell lines in CR-Plates (left) and anti-adherence treated MT-Plates (right), in Matrigel. The complete set of pictures are provided in the Supplementary File TimeSeries.zip. (B) Morphological analysis of MCTSs shown in panel A. P-values indicate the statistical significance of the effect of the type of plate (CR-Plate vs. MT-Plate) after correcting for time (multivariate linear regression, with time and plate type as explanatory variables).
Fig. 7
Fig. 7
Morphology, distribution and compactness of CRC spheroids cultured with colonic fibroblasts. (A) CRC cells stained with Biotracker 400 Blue and CCD-18Co cells stained with Biotracker 555 Orange (first column), or these cells with the dyes swapped (second column), were mixed at 1:1 proportions. Pictures were taken after 72 h of co-culture. The scale bar represents 75 μm. (B) The compaction of the cancer cells within the spheroids was measured after subtracting the area covered by the fibroblasts, since the fibroblasts formed dense foci that would increase the total spheroid compaction. (C) Percentage of the area covered by cancer cells in spheroids co-cultured with and without fibroblasts. Colours indicate the dye used to label the cancer cells (Biotracker 400 Blue or Biotracker 555 orange). Light blue or orange colours represent the CRC spheroids without CCD-18Co, and dark blue and orange indicate the co-cultures with fibroblasts. *** p-value < 0.01 (two-way ANOVA with dye and fibroblasts as explanatory variables, applied independently for each cell line).
Fig. 8
Fig. 8
Cellular organization of CRC spheroids cultured with colonic fibroblasts. (Top) MCTSs of DLD1 (left) or HCT116 (right) stained with Cell Tracker Green CMFDA (green) co-cultured with CCD-18Co fibroblasts stained with BioTracker 555 Orange Cytoplasmatic Membrane Dye (red). Images were taken after 48 h of culture in MT-Plates with 2.5 mg/mL methylcellulose, using Images were taken in a LLEICA DM1600B fluorescence microscope with 4X objective. (Middle) Stitched images of spheroids collected, decanted, and transferred to bottom-glass 8-well chambered slides (three spheroids per chamber), imaged using an Abberior STEDYCON super-resolution confocal microscope. Despite random orientation after transfer, CCD-18Co fibroblasts (red) consistently localize to the spheroid core. Yellow triangles indicate spheroids selected for Z-stack analysis. (Bottom) Composite Z-stack images of a DLD1/CCD-18Co MCTS (left) and a HCT116/CCD-18Co MCTS (right), with slices separated by 10 μm. CCD-18Co fibroblasts (red) occupy the central region, surrounded by cancer cells (green). Fluorescence signal intensity notably decreases beyond 50 μm depth.

Similar articles

References

    1. Morgan, E. et al. Global burden of colorectal cancer in 2020 and 2040: incidence and mortality estimates from GLOBOCAN. Gut72, 338–344 (2023). - PubMed
    1. Schmoll, H. J. et al. ESMO consensus guidelines for management of patients with colon and rectal cancer. A personalized approach to clinical decision making. Ann. Oncol.23, 2479–2516 (2012). - PubMed
    1. Van Cutsem, E. et al. ESMO consensus guidelines for the management of patients with metastatic colorectal cancer. Ann. Oncol.27, 1386–1422 (2016). - PubMed
    1. Araghi, M. et al. Colon and rectal cancer survival in seven high-income countries 2010–2014: variation by age and stage at diagnosis (the ICBP SURVMARK-2 project). Gut70, 114–126 (2021). - PubMed
    1. Gmeiner, W. H. Recent advances in therapeutic strategies to improve colorectal cancer treatment. Cancers16, 1029 (2024). - PMC - PubMed

Publication types

LinkOut - more resources