. 2025 Jul 29;16(1):6617.
doi: 10.1038/s41467-025-61894-9.

Senescence-associated lysosomal dysfunction impairs cystine deprivation-induced lipid peroxidation and ferroptosis

Affiliations

Senescence-associated lysosomal dysfunction impairs cystine deprivation-induced lipid peroxidation and ferroptosis

Tze Mun Loo et al. Nat Commun. .

Abstract

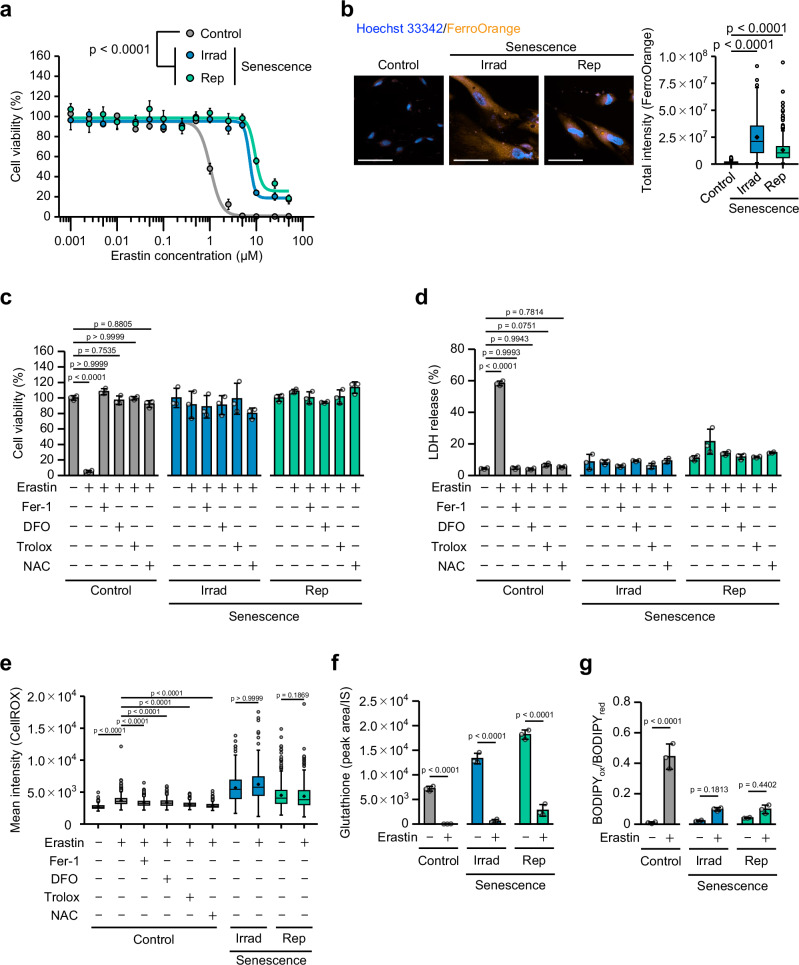
Senescent cells, characterized by irreversible cell cycle arrest and inflammatory factor secretion, promote various age-related pathologies. Senescent cells exhibit resistance to ferroptosis, a form of iron-dependent cell death; however, the underlying mechanisms remain unclear. Here, we discovered that lysosomal acidity was crucial for lipid peroxidation and ferroptosis induction by cystine deprivation. In senescent cells, lysosomal alkalinization causes the aberrant retention of ferrous iron in lysosomes, resulting in resistance to ferroptosis. Treatment with the V-ATPase activator EN6 restored lysosomal acidity and ferroptosis sensitivity in senescent cells. A similar ferroptosis resistance mechanism involving lysosomal alkalinization was observed in pancreatic cancer cell lines. EN6 treatment prevented pancreatic cancer development in xenograft and Kras mutant mouse models. Our findings reveal a link between lysosomal dysfunction and the regulation of ferroptosis, suggesting a therapeutic strategy for the treatment of age-related diseases.


Conflict of interest statement

Competing interests: The authors declare no competing interests.

Figures

Fig. 1
Fig. 1. Senescent cells are resistant to ferroptosis.
a Presenescent TIG-3 cells (Control) were rendered senescent by 15 Gy X-ray irradiation (Irrad) or passaging (replicative senescence: Rep). These cells were then subjected to a viability assay after 24 h of culture within varying concentrations of erastin. b Measurement of intracellular free ferrous iron. Representative data from three independent experiments are shown. Scale bar, 100 µm. The box plot indicates the total intensity of FerroOrange staining. ce Cell viability, LDH release and cytosolic ROS levels of control and senescent (Irrad and Rep) cells after 24 h (c, d) or 7 h (e) of treatment with 5 µM erastin alone or in combination with 500 nM ferrostatin-1 (Fer-1), 100 µM deferoxamine (DFO), 100 µM Trolox or 1 mM N-acetyl cysteine (NAC). f Quantification of the intracellular GSH content after 7 h of treatment with 5 µM erastin. g Lipid peroxidation assessed by C11-BODIPY fluorescence in control and senescent TIG-3 (Irrad and Rep) cells after 7 h of treatment with 5 µM erastin. The ratio of oxidized to reduced BODIPY (BODIPYox/BODIPYred) calculated from the median fluorescence intensity is shown. The data are presented as the mean ± s.d. of n  =  3 biological replicates (a, c, d, f, g). For b, e the box represents the interquartile range (IQR), with a horizontal line and a black point indicating the median and mean, respectively. Whiskers extend to the most extreme data points within 1.5 times the IQR from the quartiles. White points beyond this range represent outliers. Statistical analysis was performed via two-way ANOVA with Tukey’s test (a), one-way-ANOVA with Tukey’s test (c, d, f, g), or the Kruskal-Wallis test followed by Dunn’s test (b, e). Source data are provided as a Source Data file.
Fig. 2
Fig. 2. Aberrant lipid hydroperoxides in senescent cells.
a PCA analysis using lipidome data from presenescent (Control) and senescent TIG-3 (Irrad and Rep) cells after 7 h of treatment with vehicle or 5 µM erastin. b Heatmap showing changes in the lipid profiles (two-sample t-test, p < 0.05) of presenescent (Control) and senescent TIG-3 (Irrad and Rep) cells after 7 h of treatment with vehicle or 5 µM erastin. c Percentages of peroxidized PC in presenescent (Control) and senescent TIG-3 (Irrad and Rep) cells after 7 h of treatment with 5 µM erastin. d Fluorescence images of lysosomes [LysoTracker (magenta)], lipid radicals [LipiRADICAL Green (green)], and nuclei [Hoechst 33342 (blue)] in presenescent (Control) and senescent TIG-3 (Irrad and Rep) cells after 7 h of treatment with 5 µM erastin. R represents the Pearson correlation coefficient between the signals of LysoTracker and LipiRADICAL Green. Scale bar, 40 µm. e Measurement of free ferrous iron in lysosome. Scale bar, 50 µm. The box plot indicates the total intensity of LysoRhoNox staining. f Experimental schema describing the lysosomal IP method workflow. Created in BioRender. Takahashi, A. (2025) https://BioRender.com/u1pwsu5. g Immunoblot analysis of lysosome markers (LAMP1 and LAMP2), ER markers (calreticulin; CALR and protein disulfide isomerase; PDI), and a cytoplasmic marker (GAPDH) from whole-cell lysates (WCLs) of TMEM192-3xHA overexpressing TIG-3 cells, purified lysosomes (IP against HA) and 10% flowthrough (FT) of presenescent control and senescent TIG-3 (Irrad and Rep) cells. h Percentage of peroxidized PC in the lysosome or cytosol fraction from presenescent (Control) and senescent TIG-3 (Irrad and Rep) cells. For (c), (h), the data are presents as the mean ± s.d. of n  =  3 biological replicates. For (e), the box represents the interquartile range (IQR), with a horizontal line and a black point indicating the median and mean, respectively. Whiskers extend to the most extreme data points within 1.5 times the IQR from the quartiles. White points beyond this range represent outliers. Statistical analysis was performed using the two-sided Welch’s test (c), the Kruskal-Wallis test followed by Dunn’s test (e), and one-way ANOVA with Tukey’s test (h). Source data are provided as a Source Data file.
Fig. 3
Fig. 3. Downregulation of ATP6V1C2 expression inhibits the induction of ferroptosis in normal cells.
a Lysosomal pH in presenescent (Control) and senescent TIG-3 (Irrad and Rep) cells measured by LysoSensor. bf Presenescent TIG-3 cells were treated with 1 µM concanamycin C (ConC) for 24 h and subjected to lysosomal pH analysis (b) or lipid peroxidation measurement via C11-BODIPY fluorescence (c). The ratio of oxidized to reduced BODIPY (BODIPYox/BODIPYred) calculated from the median fluorescence intensity is shown. The data represent the mean ± s.d. of three independent experiments. d, e Cell viability of and LDH release by TIG-3 cells after 24 h of treatment with 5 µM erastin with or without 1 µM ConC. f Percentage of peroxidized PG, Data are presented as the mean ± s.d. of n  =  3 biological replicates. g Heatmap showing changes in the gene expression of V-ATPase components in presenescent (Control) and senescent TIG-3 (Irrad and Rep) cells. h Schematic of V-ATPase. Created in BioRender. Takahashi, A. (2025) https://BioRender.com/lhkt32a. Presenescent TIG-3 cells were subjected to transfection with the indicated siRNA oligos twice (at 2-day intervals). These cells were then subjected to RT‒qPCR analysis (i) and lysosomal pH was measured via LysoSensor (j). Cell viability (k) of and LDH release (l) by siControl- or siATP6V1C2-transfected TIG-3 cells after 24 h of treatment with 5 µM erastin. Data are presented as the mean ± s.d. of n  =  3 biological replicates (ce, k, l). For (a, b, j) the box represents the interquartile range (IQR), with a horizontal line and a black point indicating the median and mean, respectively. Whiskers extend to the most extreme data points within 1.5 times the IQR from the quartiles. White points beyond this range represent outliers. Statistical analysis was performed via the Kruskal-Wallis test followed by Dunn’s test (a, j), the two-sided Mann-Whitney U test (b), and one-way ANOVA with Tukey’s test (c, d, e, f, k, l), and one-way ANOVA with Dunnett’s test (i). Source data are provided as a Source Data file.
Fig. 4
Fig. 4. Acidic lysosomal pH induces ferroptosis in senescent cells.
a Lysosomal pH of senescent TIG-3 (Irrad and Rep) cells after 24 h of treatment with or without 50 µM EN6, as measured by LysoSensor. b Measurement of free lysosomal ferrous iron (LysoRhoNox) and intracellular ferrous iron (FerroOrange) in senescent TIG-3 (Irrad and Rep) with or without 50 µM EN6 treatment. The box plot indicates the total intensity of LysoRhoNox staining. c Fluorescence images of lysosomes [LysoTracker (magenta)], lipid radicals [LipiRADICAL Green (green)], and nuclei [Hoechst 33342 (blue)] in senescent TIG-3 (Irrad and Rep) cells after treatment with 50 µM EN6. R represents the Pearson correlation coefficient between the signals of LysoTracker and LipiRADICAL Green. Scale bar, 50 µm. d Lipid peroxidation assessed by C11-BODIPY fluorescence in senescent TIG-3 cells (Irrad and Rep) with or without 2 µM erastin (Irrad), or 5 µM erastin (Rep) in the absence or presence of 50 µM EN6 for 12 h. The ratio of oxidized to reduced BODIPY (BODIPYox/BODIPYred) calculated from the median fluorescence intensity is shown. e Heatmap of peroxidized PC in senescent TIG-3 cells (Irrad) after 14 h of treatment with or without 5 µM erastin in the absence or presence of 50 µM EN6. f, g Cell viability of and LDH release by senescent TIG-3 (Irrad and Rep) cells after 24 h of treatment with or without 5 µM erastin in the absence or presence of 50 µM EN6 and with or without Fer-1 (500 nM), DFO (100 µM), Trolox (100 µM) or NAC (1 mM). h, i Senescent TIG-3 (Irrad and Rep) cells were infected with lentivirus encoding flag-tagged ATP6V1C2 or empty vector. After selection with puromycin, the cells were subjected to immunoblot analysis (h) or lysosomal pH analysis (i). j Viability of vector control or ATP6V1C2 overexpressing senescent TIG-3 cells (Irrad and Rep) after 24 h of treatment with 5 µM erastin alone or in combination with Fer-1 (500 nM), DFO (100 µM), Trolox (100 µM) or NAC (1 mM). k Mechanism of ferroptosis resistance in senescent cells. The data are presented as the mean ± s.d. of n  =  3 biological replicates (d, f, g, j). For (a, b, i) the box represents the interquartile range (IQR), with a horizontal line and a black point indicating the median and mean, respectively. Whiskers extend to the most extreme data points within 1.5 times the IQR from the quartiles. White points beyond this range represent outliers. Statistical analysis was performed using the Kruskal-Wallis test followed by Dunn’s test (a, b, i) and one-way ANOVA with Tukey’s test (d, f, g, j). Source data are provided as a Source Data file.
Fig. 5
Fig. 5. EN6 treatment inhibits pancreatic cancer growth in vivo.
ac PANC-1 cells were treated with control vehicle or 50 nM gemcitabine (GEM) for 10 days, after which cellular senescence was induced. a Lysosomal pH of presenescent and senescent PANC-1 cells after 24 h of treatment with or without 50 µM EN6. b, c Cell viability of and LDH release by PANC-1 and senescent PANC-1 cells after 24 h of treatment with or without 5 µM erastin in the absence or presence of 50 µM EN6 and with Fer-1 (500 nM), DFO (100 µM), Trolox (100 µM) or NAC (1 mM). d Schematic representation of the PANC-1 xenograft mouse model. e Relative tumor growth rates of PANC-1 xenografts after 34 days of treatment with vehicle or EN6 (50 mg/kg, i.p., every 3 days). The arrow indicates the date when the treatment was started. f Images of xenograft tumors harvested from mice. Scale bar, 1 cm. Tumor weight measurements of PANC-1 xenografts after 34 days of treatment with vehicle or EN6 (50 mg/kg, i.p., every 3 days). g Representative images of IHC staining of PANC-1 xenografts after 34 days of treatment with vehicle or EN6 (50 mg/kg, i.p., every three days). Scale bar, 100 µm. The plot shows the percentage of the positive area of 4-HNE and Ptsg2 IHC staining in vehicle- and EN6-treated PANC-1 tumors. Data are represented as mean  ±  s.d For (b, c) the data are presented as the mean ± s.d. of n  =  3 biological replicates. For a the box represents the interquartile range (IQR), with a horizontal line and a black point indicating the median and mean, respectively. Whiskers extend to the most extreme data points within 1.5 times the IQR from the quartiles. White points beyond this range represent outliers. For (e, f) the data are presented as the mean ± s.d. of n  =  6 (Vehicle), n  =  7 (EN6) biological replicates. Statistical analysis was performed using the Kruskal-Wallis test followed by Dunn’s test (a), one-way-ANOVA with Tukey’s test (b, c), and the two-sided Mann-Whitney U test (e, f, g). Source data are provided as a Source Data file.
Fig. 6
Fig. 6. EN6 treatment prevents pancreatic cancer development.
a Schematic representation of the pancreatic cancer mouse model. b Pancreatic weight measurements after 21 days of vehicle or EN6 treatment. c Representative images of IHC staining of the pancreas after 21 days of treatment with vehicle or EN6 (50 mg/kg, i.p., every three days). Scale bar, 100 µm. The plot shows the percentage of the positive area of 4-HNE and Ptsg2 IHC staining in vehicle- and EN6-treated pancreatic tumors. d UMAP embedding of the expression profile for 11,524 pancreatic cells that passed quality control colored by cell type. e Module score violin plots showing the ferroptosis signature between normal epithelial cells and tumor cells. f Module score violin plots (left) depicting the ferroptosis signature across tumor cell clusters. The bar plot (right) shows the number of tumor cells (clusters 5, 9, and 10) in mice treated with vehicle or EN6. g Module score violin plots showing the ferroptosis signature between normal fibroblasts and CAFs. h Bar plot showing the count of CAFs (clusters 3, 6, 7, 9) in mice treated with vehicle or EN6. i Module score violin plots showing the lysosomal lumen acidification between CAF cluster 6 and 3, 7, 9. j Correlation analysis represented as a scatter plot showing the relationship between the enrichment of the cellular senescence gene set (SAUL_SEN_MAYO) and the enrichment of the V-ATPase component gene (V-ATPase component). k Violin plots showing Ctla4 gene expression in CD8+ T cells clusters from mice treated with vehicle or EN6. Bar plot showing the percentage of each cell type cluster. For b the box represents the interquartile range (IQR), with a horizontal line and a black point indicating the median and mean, respectively. Whiskers extend to the most extreme data points within 1.5 times the IQR from the quartiles. White points beyond this range represent outliers. For (e, f, g, I, and k), all data points are shown along with violin plots representing their distribution. The box represents the interquartile range (IQR), with a horizontal line indicating the median. Whiskers extend to the most extreme data points within 1.5 times the IQR from the quartiles. For (b, c) the data are presented as the mean ± s.d. over three biologically independent samples. Statistical analysis was performed using the Kruskal-Wallis test followed by Dunn’s test (b, c), two-sided Welch’s test (e, g, i, k), ordinary one-way ANOVA followed by Benjamini and Hochberg multiple comparison test (f) and Pearson correlative analysis (j). Source data are provided as a Source Data file.

References

    1. Gorgoulis, V. et al. Cellular senescence: defining a path forward. Cell179, 813–827 (2019). - PubMed
    1. Takahashi, A. et al. Mitogenic signalling and the p16INK4a–Rb pathway cooperate to enforce irreversible cellular senescence. Nat. Cell Biol.8, 1291–1297 (2006). - PubMed
    1. López-Otín, C., Blasco, M. A., Partridge, L., Serrano, M. & Kroemer, G. Hallmarks of aging: an expanding universe. Cell186, 243–278 (2023). - PubMed
    1. Kim, Y., Jang, Y., Kim, M.-S. & Kang, C. Metabolic remodeling in cancer and senescence and its therapeutic implications. Trends Endocrinol. Metab.35, 732–744 (2024). - PubMed
    1. Ma, S. et al. Spatial transcriptomic landscape unveils immunoglobin-associated senescence as a hallmark of aging. Cell187, 7025–7044 (2024). - PubMed