. 2025 Jul 29;15(1):27630.
doi: 10.1038/s41598-025-11213-5.

A new class of human CpG Island promoters with primate-specific repeats

Affiliations

A new class of human CpG Island promoters with primate-specific repeats

K Naga Mohan et al. Sci Rep. .

Abstract

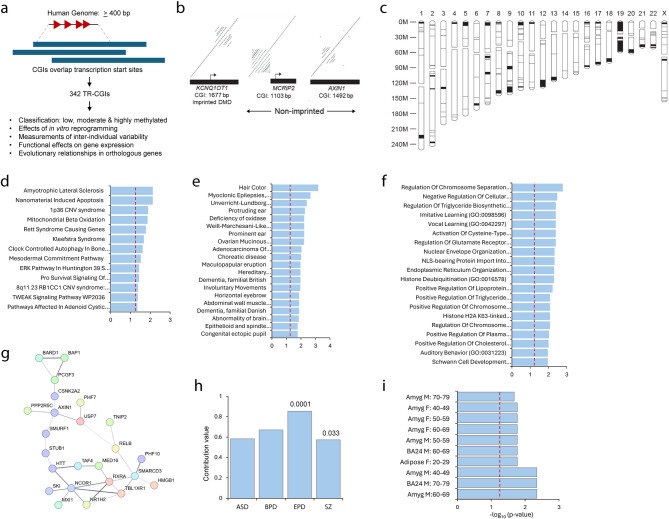
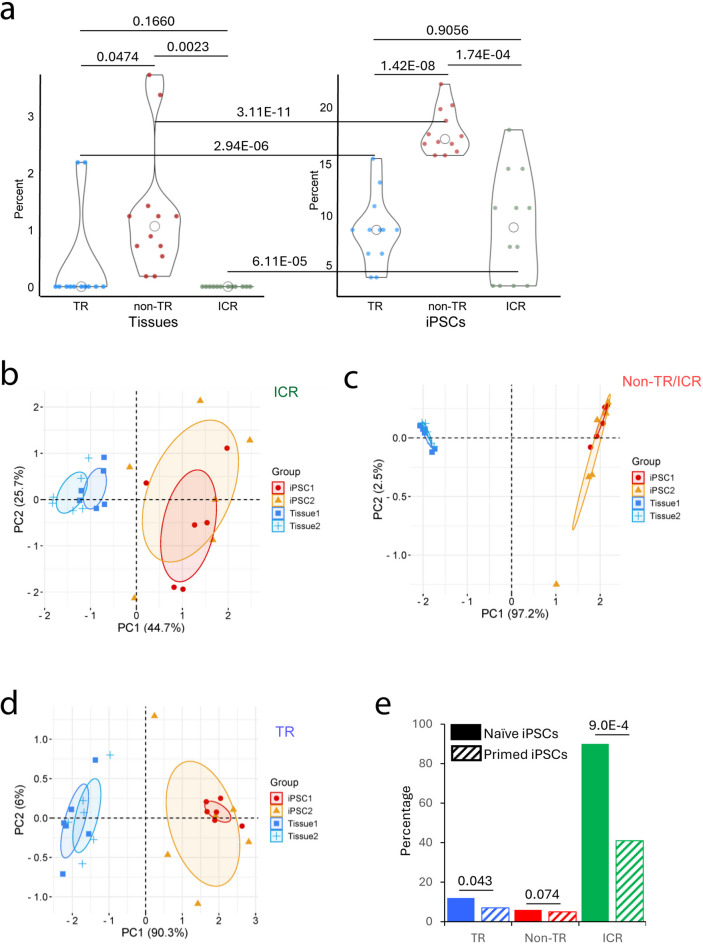
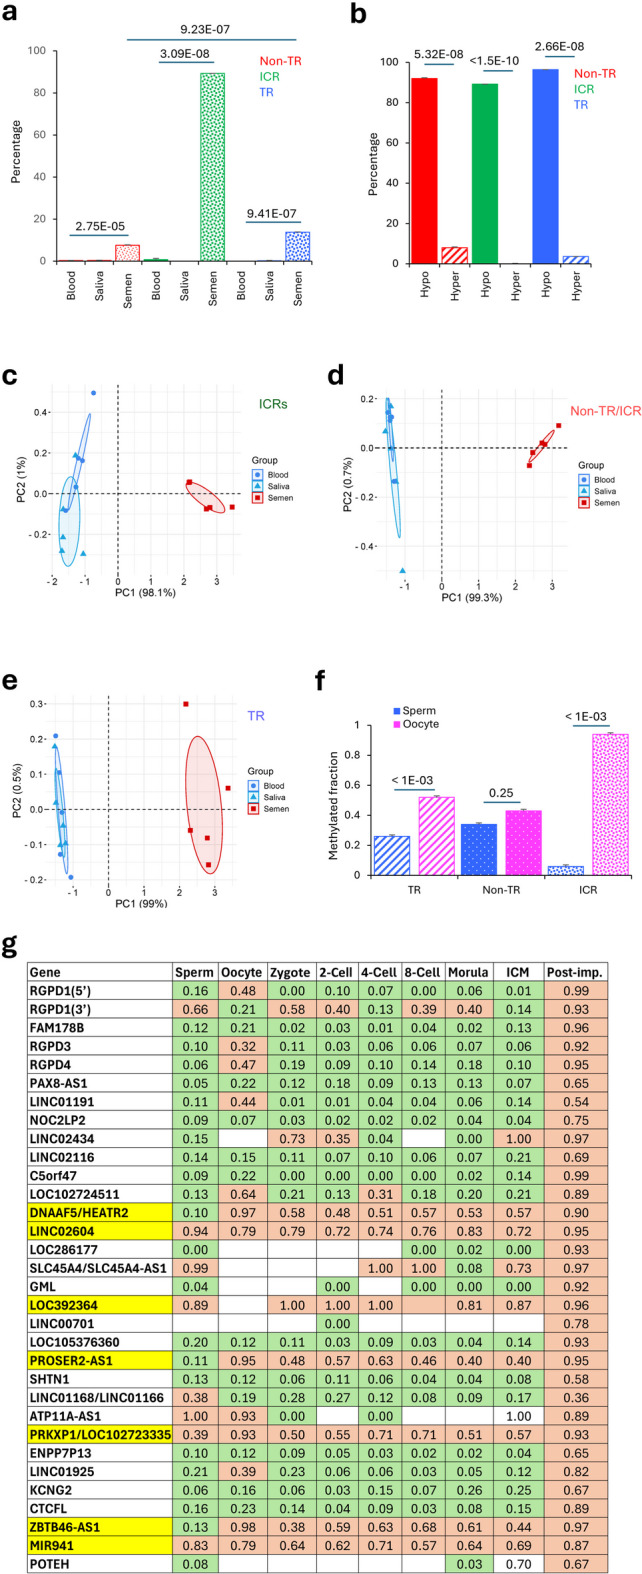
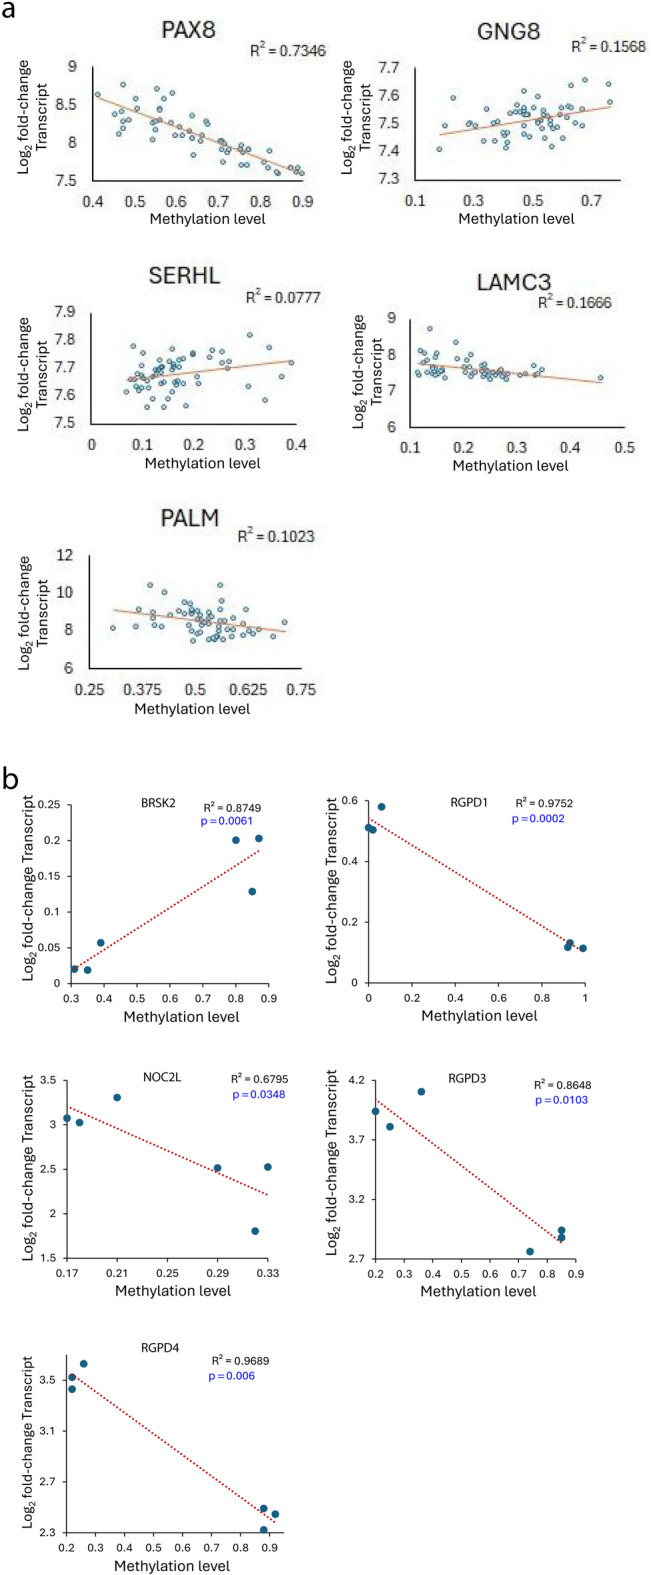
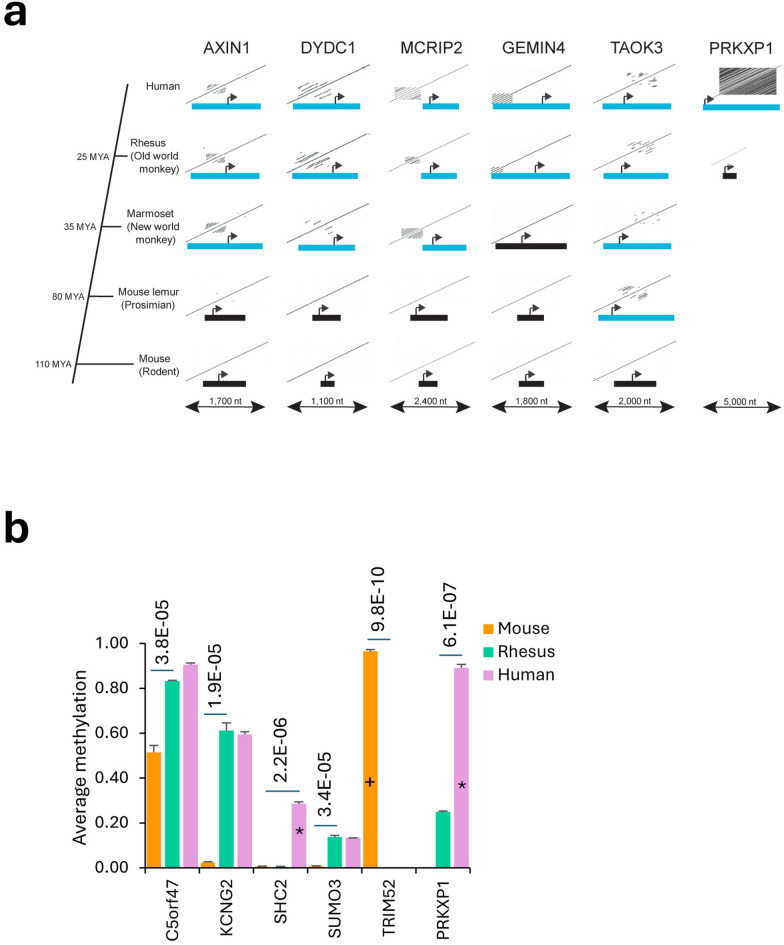
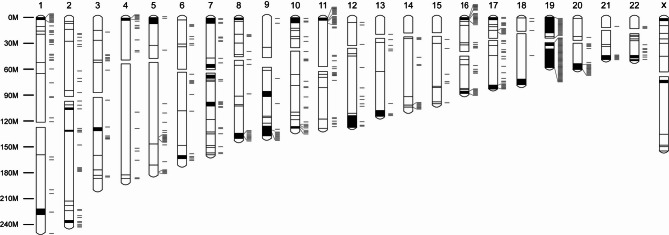
A subset of imprinting control regions (ICRs) in the human and mouse possess CpG islands associated with imperfect tandem repeats (TRs) that were shown to be essential for genomic imprinting through genetic studies. To identify whether this feature is also present in non-imprinted CpG island promoters, we performed extensive dot plot analyses and identified 342 (326 autosomal and 16 X-chromosomal) human CpG island gene promoters associated with imperfect TRs of ≥ 400 bp, unit lengths 50-150 bp. Most occur as clusters at the human chromosome ends, distinct from the clusters of imprinted genes, and enriched in neurodevelopmental/behavioral disorders, with some showing interindividual variation in methylation levels. A subset of TR-CGIs is highly methylated and remains so during reprogramming to primed iPSCs, but become unmethylated in naïve iPSCs, as in the case of ICRs. Transcript levels correlate with methylation levels for some TR-CGI genes suggesting their gene regulatory potential. Non-TR CGI mouse orthologs of methylated human TR-CGIs are unmethylated in mouse, suggesting the association of TRs with higher methylation levels. Most human TR-CGIs accompanied primate evolution after divergence from mouse TR-CGIs with evidence of recent additions in hominid evolution. In summary, the incorporation of TRs in certain CGI promoters in mammalian evolution results in the unique ability to acquire methylation during human embryonic development and resist reprogramming to a pluripotent stem cell state with an effect on gene expression.

Keywords: CpG Island; DNA methylation; Epigenetic reprogramming; Genome organization; Genomic imprinting Repeat; Human evolution; Stem cells.


Conflict of interest statement

Declarations. Competing interests: The authors declare no competing interests. Data and materials availability: No new sequence data or materials were generated. Results reported in this manuscript were after analysis of the following publicly available GEO DataSets: GSE49828 The DNA methylation landscape of human early embryos. GSE51239 DNA methylation dynamics of the human pre-implantation embryo. GSE76641 DNA Methylation Barcodes in Human Fetal Tissues and Human Induced Pluripotent Stem Cells. GSE76970 Reversion to naïve human pluripotency creates a new methylation landscape devoid of blastocyst or germline memory. GSE80970 Cortical hypermethylation across an extended region spanning the HOXA gene cluster on chromosome 7 is robustly associated with Alzheimer’s disease neuropathology. GSE110366 Profiling the DNA methylation pattern in naïve induced Pluripotent Stem cells and somatic cells. GSE120137 A multi-tissue full lifespan epigenetic clock for mice. GSE124708 Hyperandrogenemia and western-style diet act synergistically on transcription and DNA methylation in visceral adipose tissue of a non-human primate model. GSE129548 CGGBP1 regulates chromatin barrier activity and CTCF occupancy at repeats. GSE175195 TF ChIP-seq from HEK293. GSE175320 Histone ChIP-seq from HEK293. GSE200834 TNRC18 recognizes H3K9me3 to mediate transposable elements silencing at ERV regions. GSE200839 TNRC18 recognizes H3K9me3 to mediate transposable elements silencing at ERV regions. GSE233417 A comprehensive DNA methylation atlas for noncancer human tissue types. GSE247551 SPINDOC promotes genome-wide redistribution of Spindlin1. GSE109559 Cell type and species-specific methylation patterns in neuronal and non-neuronal cells of human and chimpanzee cortex. GSE53261 The relationship between DNA methylation, genetic and expression inter-individual variation in untransformed human fibroblasts.

Figures

Fig. 1
Fig. 1
Identification and characterization of human CpG islands (CGIs) upstream or overlapping transcription start sites and containing tandem repeat sequences. (A) Schema for determining features of tandem repeat (TR)-containing CGIs at promoter regions. (B) Two examples of non-imprinted genes with TRs and their comparison with the KCNQ1OT1 imprinted region. Lines parallel to the central diagonal indicate the presence of tandem repeats; the number of lines is the number of repeats, and space between lines is the sequence length of a unit copy. (C) Chromosomal locations of the identified non-imprinted genes with TRs either in or within 200 bp of CGI promoters. Horizontal lines indicate individual genes whereas filled rectangles indicate gene clusters. (D-F) Top twenty most significant terms identified by DisGenet, Wikipathway and Biological process analyses. Vertical dashed red lines represent p value cutoff of 0.05. (G) Protein-protein interaction analysis of genes with TR-CGI promoters. (H) Proportions of genes associated with autism spectrum (ASD), bipolar (BPD), epilepsy (EPD) and schizophrenia (SZ). The horizontal dashed line indicates the expected value. The p values are given on the top of the histograms. (I) GTEx-analysis of genes with TR-CGIs in promoters. Vertical dashed lines represent p values of 0.05.
Fig. 2
Fig. 2
Sequence features, methylation levels and chromatin modifications associated with the TR-CGIs. (A) GC content and CpG ratio analyses of imprinting control regions (ICRs), TR-CGIs and non-TR & non-ICR CGIs (Non-TR). (B) Proportions of TR-CGIs (blue), non-TR CGIs (red), and ICRs (green) methylated in seven human tissues (muscle, adipose, skin, liver, thyroid, cerebral cortex NeuN+, cerebral cortex NeuN-), three samples each. (C) PCA of TR-CGIs in seven different tissue types. (D) Heat map of TR-CGI methylation of 59 loci in 62 independent primary fibroblast cell lines. (E) Example of tissue-specific DNA methylation in a TR-CGI (LIG4). (F) UCSC browser screenshot showing the methylation levels of the RGPD1 5’-most TR-CGI in six different tissues from different individuals. Sample identities are given above each track with black vertical lines. The height of each vertical line represents the methylation value (0.0 corresponds to 0% methylation, whereas 1.0 represents 100%) of the CpG site. (G) Analysis of ZFP57 binding sites in ICR, Non-TR and TR-CGIs. (H) Proportion of methylated TR-CGIs (blue), ICRs (green) and sample of 37 non-TR CGIs (red) occupied by H3K9Me3, H3K36Me3 and SETDB1. The results were obtained after analysis of publicly available datasets: GSE109559, GSE53261, GSE233417, GSE247551, GSE200839, GSE200834, GSE175320, GSE175195, GSE129548.
Fig. 3
Fig. 3
Reprogramming of TR-CGIs, non-TR CGIs and ICRs (A) Changes in methylation of TR-CGIs (blue), non-TR CGIs (red), and ICRs (green) during reprogramming of tissue to primed iPSCs. Dots are different tissues from which iPSCs were derived. (B–D) Principal Components Analysis (PCA) of ICRs, nonTR-CGIs and TR CGIs based on their methylation levels in the multiple tissues and their iPSCs. The dots represent different samples. (E) Percentages of the three sequence classes (TR-CGIs, non-TR CGIs and ICRs) undergoing methylation changes (≥20%) in transition from BJ fibroblasts to either naïve or primed iPSCs. The results were obtained after analysis of publicly available datasets: GSE200834, GSE76970, GSE110366, GSE76641.
Fig. 4
Fig. 4
Effects of spermatogenesis-associated reprogramming on the methylation levels of TR-CGIs. (A) Proportion of non-TR CGIs (red), ICRs (green), and TR-CGIs (blue) with differences in methylation between blood/saliva and semen. Values were determined by comparing the same samples from five different individuals. Average methylation levels in the blood and saliva (body fluids) are used as reference. (B) Most changes between blood/saliva and sperm for non-TR CGIs (red), ICRs (green) and TR-CGIs (blue) involve hypomethylation. (C–E) PCA analyses of the three different categories of CGIs based on their methylation levels in blood, saliva and semen. (F) Methylated fractions of TR-CGIs, non-TR CGIs and ICRs in sperm and MII oocytes. (G) TR-CGI methylation from gametes through preimplantation cleavage stages and post-implantation embryos. Values are methylated fractions of CGI CpGs. Seven TR-CGIs highlighted in yellow are methylated in all preimplantation stages. 32 TR-CGIs were examined. Green rectangles – low methylation. Salmon rectangles – high methylation. Data are taken from publicly available datasets: GSE49828, GSE51239.
Fig. 5
Fig. 5
Relationship between the levels of methylation of TR-CGI promoters and their transcripts. Correlation plots showing methylation levels on the X-axis and expression levels on the Y-axis for (A) five TR-CGI genes in fibroblasts from 62 individuals and (B) five TR-CGI genes in isogenic primed and naïve iPSCs. Data was taken from three samples each of naïve and primed hESCs. The results were obtained after analysis of publicly available datasets: GSE76970.
Fig. 6
Fig. 6
Evolutionary origins of TRs in TR-CGI genes. (A) For each orthologous gene, dot plots of the CGI-promoters and surrounding sequences from the five species are displayed. Blue rectangles are TR-CGIs and black rectangles are CGIs without TRs. Arrows are transcriptional start sites and directions of transcription. (B) Comparisons of methylation profiles of orthologous genes in human, Rhesus macaque and mouse. *** indicates p values < 0.0001 estimated by Fisher’s paired t-test. *TR present in human, but not in Rhesus macaque or mouse. +TR present in mouse, but not in human or Rhesus macaque. The results were obtained after analysis of publicly available datasets: GSE124708, GSE110366, GSE233417, GSE120137.
Fig. 7
Fig. 7
Locations of methylated human non-TR CGIs on ideogram of TR-CGIs. Genomic positions of 506 non-TR CGIs with > 30% methylation in BJ fibroblasts were determined and placed along with positions of TR-CGIs on the human chromosome ideogram. The results were obtained after analysis of publicly available dataset: GSE110366.

References

    1. Eggermann, T. et al. Imprinting disorders. Nat. Rev. Dis. Primers. 9(1), 33 (2023). - PubMed
    1. Hutter, B., Helms, V. & Paulsen, M. Tandem repeats in the CpG islands of imprinted genes. Genomics88(3), 323–332 (2006). - PubMed
    1. Watanabe, T. et al. Role for PiRNAs and noncoding RNA in de Novo DNA methylation of the imprinted mouse Rasgrf1 locus. Science332 (6031), 848–852 (2011). - PMC - PubMed
    1. Saito, T. et al. A tandem repeat array in IG-DMR is essential for imprinting of paternal allele at the Dlk1-Dio3 domain during embryonic development. Hum. Mol. Genet.27 (18), 3283–3292 (2018). - PubMed
    1. Reinhart, B., Eljanne, M. & Chaillet, J. R. Shared role for differentially methylated domains of imprinted genes. Mol. Cell. Biol.22 (7), 2089–2098 (2002). - PMC - PubMed

LinkOut - more resources