. 2025 Jul 29;8(1):1118.
doi: 10.1038/s42003-025-08565-z.

Endoplasmic reticulum-mitochondria coupling prompts ZBP1-mediated RPE cell PANoptosis in age-related macular degeneration

Affiliations

Endoplasmic reticulum-mitochondria coupling prompts ZBP1-mediated RPE cell PANoptosis in age-related macular degeneration

Ao Zhang et al. Commun Biol. .

Abstract

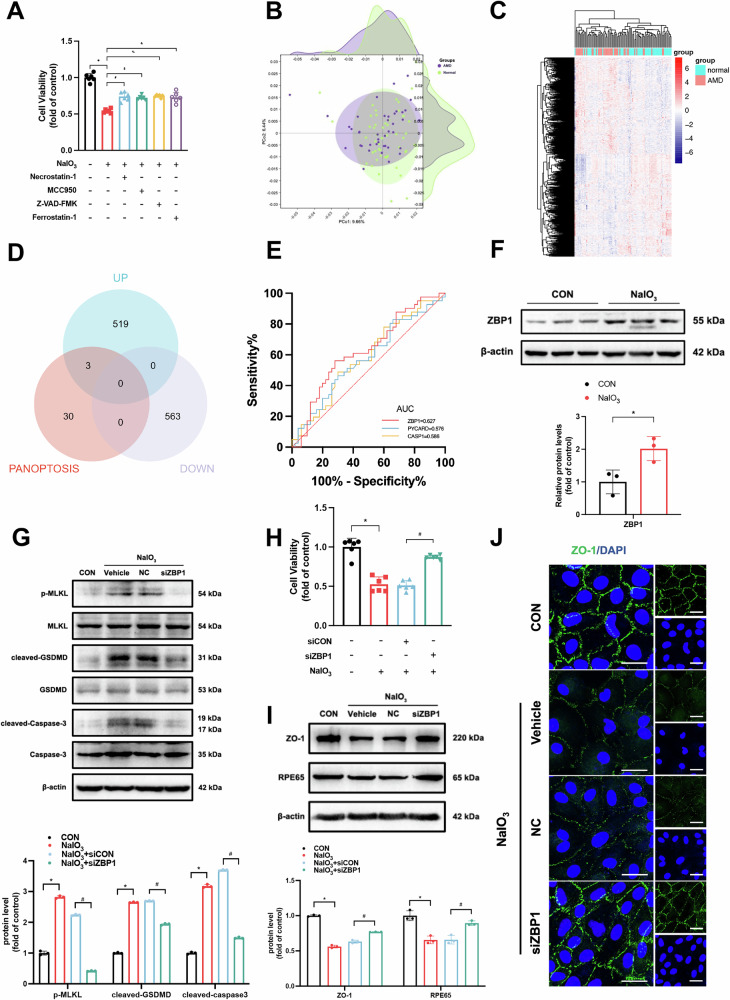
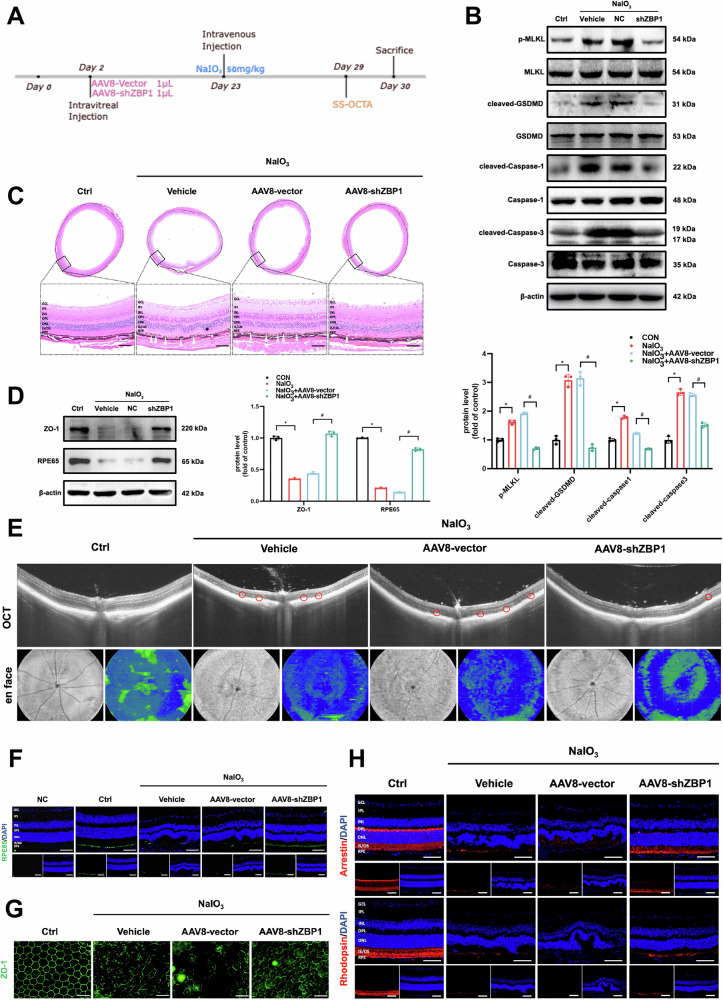
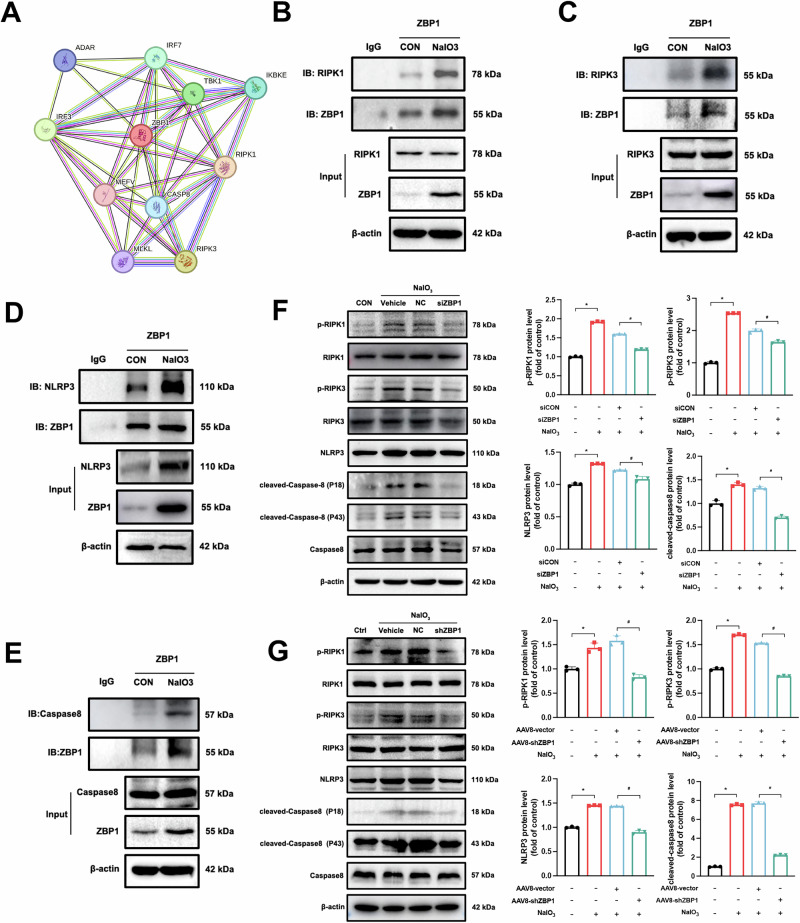
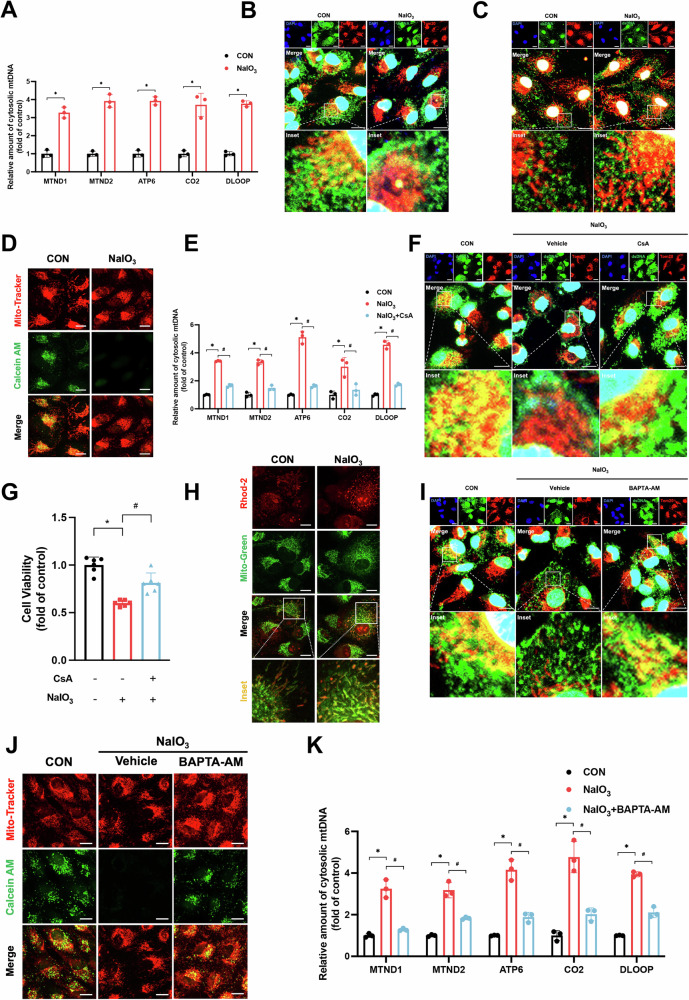
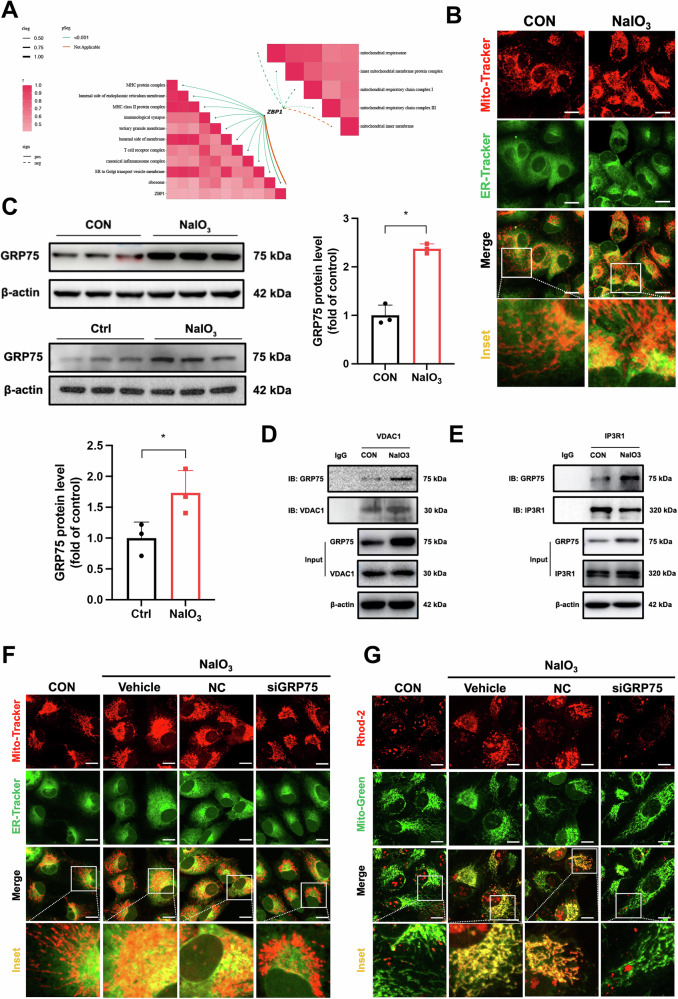
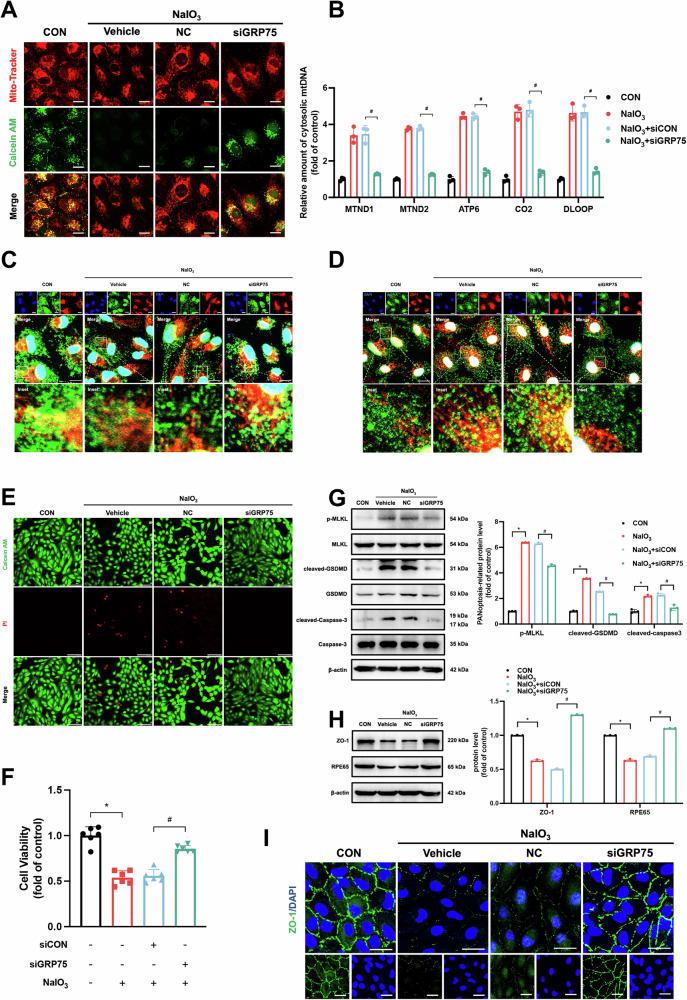
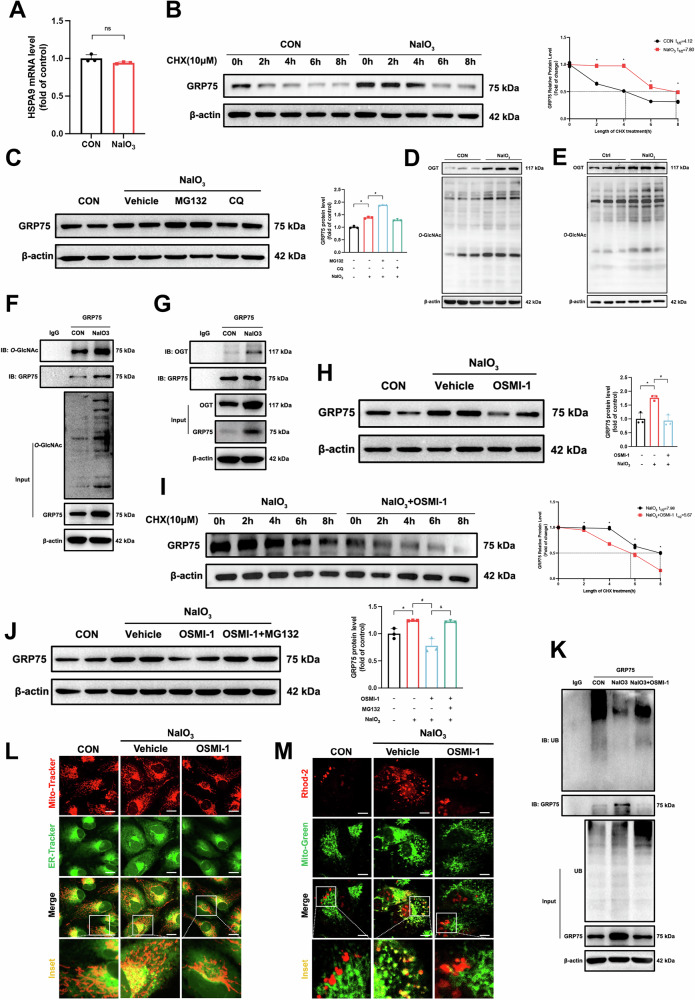
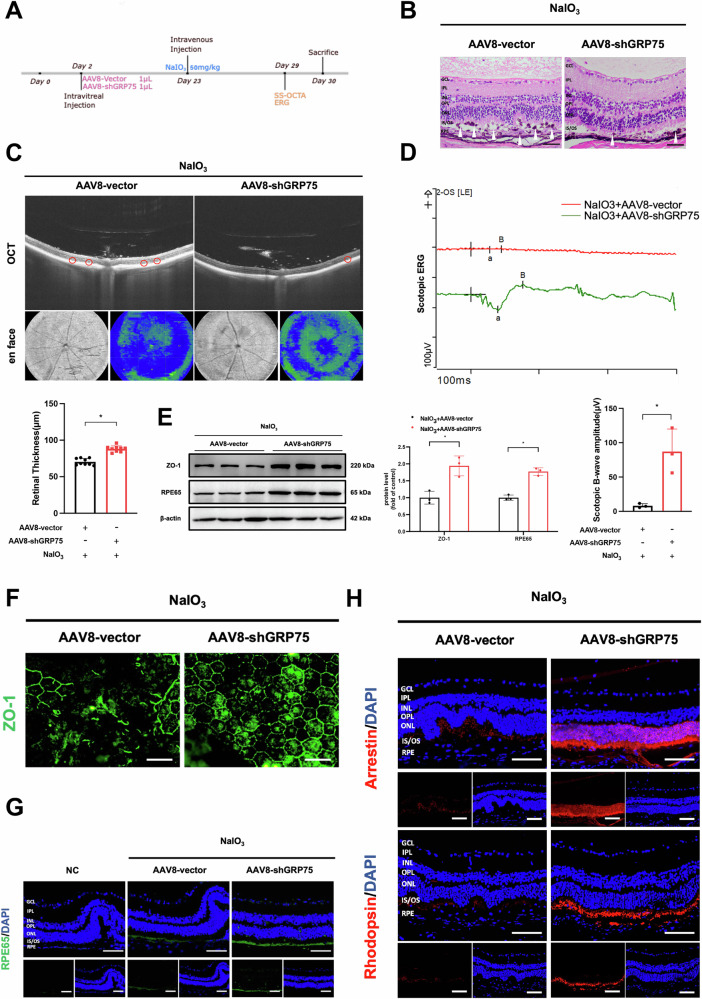
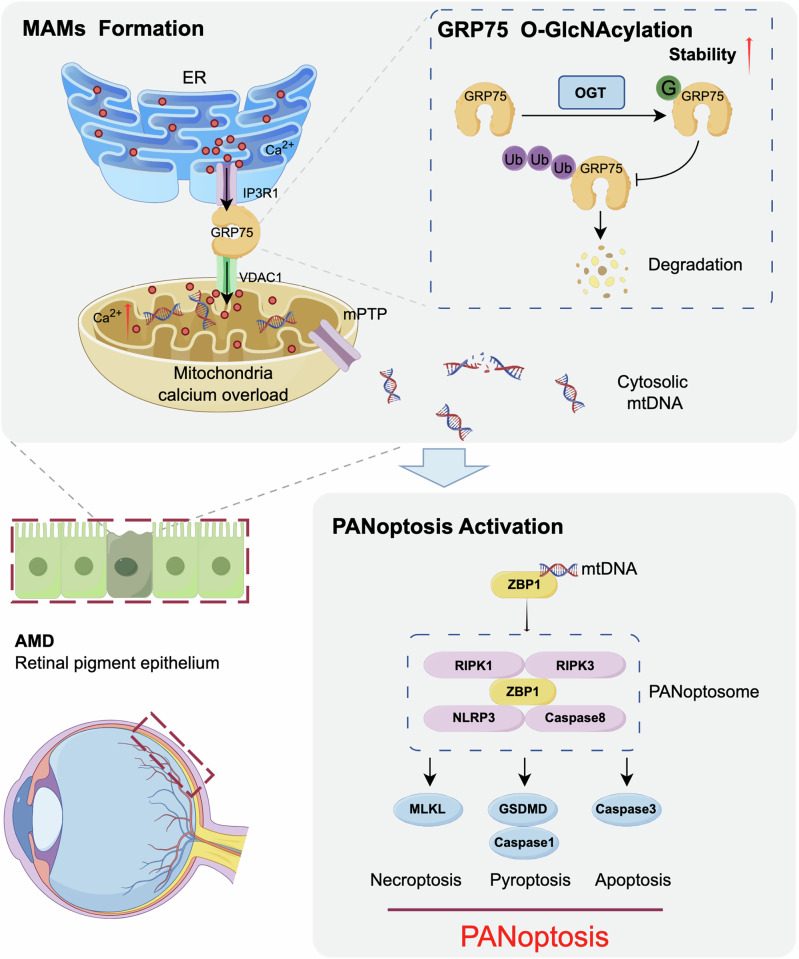
Age-related macular degeneration (AMD) is the leading cause of central vision impairment among the elderly. Geographic atrophy is a defining characteristic of AMD, but the detailed mechanism for massive loss of retinal pigment epithelium (RPE) cells is not fully understood. In this study, we found that Z-DNA binding protein 1 (ZBP1), a sensor for dsDNA, is able to induce RPE cell PANoptosis. Silencing ZBP1 efficiently alleviates RPE degeneration and AMD symptoms. Mechanistically, mitochondrial permeability transition pore (mPTP) opening stimulated by Ca2+ overload can trigger the releasing of mtDNA, which leads to ZBP1 activation and PANoptosis. Importantly, our findings reveal a significant role of aberrant formation of mitochondria-associated ER membranes (MAMs) in AMD. MAMs act as conduits for transferring Ca2+ from the ER to mitochondria through the VDAC1/GRP75/IP3R1 complex. Furthermore, our results indicate that GRP75 O-GlcNAcylation is involved in MAM formation. Genetic suppression of GRP75 attenuates PANoptosis and AMD progression. In summary, our study sheds light on the intricate organelle interplay underlying AMD and presents insights into potential avenues for AMD intervention.


Conflict of interest statement

Competing interests: The authors declare no competing interests.

Figures

Fig. 1
Fig. 1. ZBP1 is highly expressed in NaIO3-induced mice and AMD patients.
A ARPE-19 cells were pretreated with the indicated inhibitors for 2 h in DMEM/F12 medium supplemented with 2% FBS before treatment of 10 mM NaIO3 for 24 h, CCK-8 assay showing ARPE-19 cell viability in the indicated groups (n = 6). B Visualization of principle component analysis (PCA) of GSE29801 dataset (purple: AMD samples; green: normal samples). C Heatmap of RNA-seq data displaying the differential expression gene (DEG) between AMD and normal macular RPE-choroid samples in GSE29801 dataset. D Venn diagram illustrating the overlapped targets of upregulated DEG, downregulated DEG and PANoptosis-related genes (obtained from GeneCards database). E The ROC curve of ZBP1, PYCARD, CASP1. ZBP1 exhibits optimal diagnostic efficacy. F ZBP1 protein expression in primary mouse RPE cells by immunoblots analysis. Quantification of the protein levels relative to β-actin expression are shown. G PANoptosis-related protein expressions (p-MLKL, MLKL, cleaved-GSDMD, GSDMD, cleaved-Caspase3, Caspase3) in primary mouse RPE cells by immunoblots analysis. Quantification of the protein levels are shown. H CCK-8 assay showing ARPE-19 cells viability in the indicated groups (n = 6). I RPE65 and ZO-1 expressions in primary mouse RPE cells by immunoblots analysis. Quantification of the protein levels relative to β-actin expression are shown. J ARPE-19 cells stained with ZO-1 (green) and DAPI (blue) showing the ARPE-19 cells dysfunction treated with NaIO3, and these changes can be reversed significantly by ZBP1 siRNA. Scale bars = 25 μm. Data are mean ± SD, the p values were obtained using one-way ANNOVA. *p < 0.05 versus control group. #p < 0.05 versus NC group.
Fig. 2
Fig. 2. ZBP1 silencing alleviates PANoptosis in an in vivo model of AMD.
A Flowchart of the in vivo experiments. B PANoptosis-related protein expressions (p-MLKL, MLKL, cleaved-GSDMD, GSDMD, cleaved-Caspase1, Caspase1, cleaved-Caspase3, Caspase3) in mice RPE by immunoblots analysis. Quantification of the protein levels are shown. C The H&E staining of mice retinas. white triangle: impaired RPE cells; black asterisk: subsidence of outer nuclear layer (ONL). Scale bars = 50 μm. D RPE65 and ZO-1 expressions in mice RPE by immunoblots analysis. Quantification of the protein levels relative to β-actin expression are shown. E Retinal OCT and ultra-wide angle en face images obtained from SS-OCTA showing an abundant number of punctate hyperreflective signals (red circle: impaired RPE cells or misalignment of the ONL layer) and thinning of ONL in the NaIO3-treated mice and administration of AAV8-shZBP1 reversed the above abnormalities. F, G Immunofluorescent staining of RPE65 and ZO-1 in the indicated groups of mice retinas. Scale bars = 50 μm (NC: staining without primary antibody). H Immunofluorescent staining of photoreceptor functional indicators (Arrestin, Rhodopsin) in the indicated groups of mice retinas. Scale bars = 50 μm. Data are mean ± SD, the p values were obtained using one-way ANNOVA (B, D). *p < 0.05 versus Ctrl group, #p < 0.05 versus NC group.
Fig. 3
Fig. 3. RIP1 and RIP3 are recruited to ZBP1-panoptosome for activation of PANoptosis.
A Visualization of PPI network among ZBP1 and its predicted functional partners, RIP1 (0.998) and RIP3 (0.996), exhibits the top 2 interaction scores. BE ZBP1 immunoprecipitation (IP) with anti-RIPK1, anti-RIPK3, anti-NLRP3, and anti-Caspase8 showing the formation of ZBP1-panoptosome in ARPE-19 cells. F, G Panoptosome-related protein (p-RIPK1, RIPK1, p-RIPK3, RIPK3, NLRP3, cleaved-Caspase8, Caspase8) expressions in both ARPE-19 cells and NaIO3-induced mice by immunoblots analysis. Quantification of the protein levels are shown. Data are mean ± SD, the p values were obtained using one-way ANNOVA (F, G). *p < 0.05 versus control (CON/Ctrl) group, #p < 0.05 versus NC group.
Fig. 4
Fig. 4. Calcium dyshomeostasis leads to release of mtDNA and activation of ZBP1.
A, E, K qRT-PCR assay showing the cytoplasmic mtDNA (MTND1, MTND2, ATP6, CO2, DLOOP) level. A Cytoplasmic mtDNA levels in ARPE-19 cells were elevated by NaIO3 (n = 3). E, K CsA (mPTP inhibitor) and BAPTA-AM (Ca2+ chelator) reversed the elevated cytoplasmic mtDNA induced by NaIO3 (n = 3). B, F, I NaIO3 induces (B) relocation of dsDNA (anti-dsDNA, green) from mitochondria (anti-TOMM20, red) into cytoplasm and was abolished by CsA (F) or BAPTA-AM (I). Nucleus were stained with DAPI. Scale bars = 25 μm. C Immunofluorescence staining shows elevated colocalization between ZBP1 (anti-ZBP1, red) and dsDNA (anti-dsDNA, green) under stimulation of NaIO3. Scale bars = 25 μm. D, J The mPTP was opened in NaIO3 treated ARPE-19 cells (D) and the abnormal phenomena was abolished by administration of BAPTA-AM (J). G CCK-8 assay showing ARPE-19 cells viability in the indicated groups (n = 6). H Representative immunofluorescence staining images showing elevated colocalization (yellow) between Rhod-2 (red) and mitochondria (Mito-Green, green) in ARPE-19 cells under NaIO3 stimulation. Scale bars = 25 μm. Data are mean ± SD, the p values were obtained using one-way ANNOVA (E, G, K) or unpaired t-test (A). *p < 0.05 and #p < 0.05 versus NaIO3 group.
Fig. 5
Fig. 5. MAMs regulate mitochondrial Ca2+ homeostasis through IP3R1-GRP75-VDAC1 axis.
A Correlation between ZBP1 and the enrichment scores of top 10 cellular components (based on ssGSEA analysis) shown in bottom left. Correlation between ZBP1 and the enrichment scores of mitochondria-related cellular components shown in top right. B Immunofluorescence staining showing colocalization (yellow) between ER (ER-Tracker, green) and mitochondria (Mito-Tracker, red). Scale bars = 25 μm. C GRP75 protein expression in both primary mouse RPE cells and NaIO3-induced mice by immunoblots analysis. Quantification of the GRP75 levels relative to β-actin expression is shown. D, E VDAC1 and IP3R1 immunoprecipitation (IP) with anti-GRP75 showing the interaction between GRP75 and VDAC1, IP3R1 in ARPE-19 cells. Immunofluorescence staining showing elevated colocalization (yellow) between F ER (ER-Tracker, green) and mitochondria (Mito-Tracker, red) and G Rhod-2 (red) and mitochondria (Mito-Green, green) in ARPE-19 cells under NaIO3 stimulation and GRP75 siRNA significantly reversed the above phenomenon. Scale bars = 25 μm. Data are mean ± SD, the p values were calculated using unpaired t-test between control (CON/Ctrl) and NaIO3-induced ARPE-19 cells or mice. *p < 0.05 versus control group.
Fig. 6
Fig. 6. GRP75 silencing ameliorates ZBP1 activation and PANoptosis.
ARPE-19 cells were transfected with GRP75 siRNA under NaIO3 (10 mM, 24 h) stimulation. A Immunofluorescence staining reveals that mPTP opening in ARPE-19 cells were decreased significantly by GRP75 siRNA. Scale bars = 25 μm. B qRT-PCR assay showing that elevated cytoplasmic mtDNA (MTND1, MTND2, ATP6, CO2, DLOOP) level stimulated by NaIO3 were reversed after treatment with GRP75 siRNA (n = 3). Immunofluorescence staining showing that NaIO3 induces C relocation of dsDNA (anti-dsDNA, green) from mitochondria (anti-TOMM20, red) into cytoplasm and D sensed by ZBP1 (anti-ZBP1, red). Nuclei were stained with DAPI. GRP75 siRNA decreased C the dsDNA leakage and D colocalization of dsDNA with ZBP1. Scale bars = 25 μm. E Calcein-AM/PI assay reveals dead (red) and live (green) ARPE-19 cells. Scale bars = 50 μm. F CCK-8 assay showing ARPE-19 cells viability (n = 6). G PANoptosis-related protein expressions (p-MLKL, MLKL, cleaved-GSDMD, GSDMD, cleaved-Caspase3, Caspase3) in primary mouse RPE cells by immunoblots analysis. H RPE65 and ZO-1 expressions in primary mouse RPE cells by immunoblots analysis. I ARPE-19 cells stained with ZO-1 (green) and DAPI (blue) showing ARPE-19 cells dysfunction treated with NaIO3 and was reversed significantly by GRP75 siRNA. Scale bars = 25 μm. Data are mean ± SD, the p values were obtained using one-way ANNOVA (FH) or unpaired t-test (B). *p < 0.05 versus control group, #p < 0.05 versus NC group.
Fig. 7
Fig. 7. O-GlcNAcylation of GRP75 regulates its ubiquitination and abundance.
A qRT-PCR assay showing mRNA levels of HSPA9 (n = 3). B, I Half-life and quantitative analysis of GRP75 in APRE-19 cells treated with the indicated agents. Cells were treated with 10 μM cycloheximide (CHX) for the indicated time and immunoblotted with anti-GRP75 and anti-β-actin antibodies. Quantification of the GRP75 levels relative to β-actin expression are shown. C, H, J GRP75 protein expression in ARPE-19 cells treated with indicated agents by immunoblots analysis. D, EO-GlcNAcylation level in both ARPE-19 cells and NaIO3-induced mice by immunoblots analysis. F, G GRP75 immunoprecipitation (IP) with anti-O-GlcNAc and anti-OGT showing the O-GlcNAcylation of GRP75 in ARPE-19 cells. K Co-IP of GRP75 and Ubiquitin in ARPE-19 cells. L Representative images of ARPE-19 cells treated with vehicle or OSMI-1 and stained with Mito-Tracker (red) and ER-Tracker (green) showing the binding between the ER and mitochondria in ARPE-19. Scale bars = 25 μm. M ARPE-19 cells stained with Rhod-2 (red) and Mito-Green (green) showing the mitochondrial Ca2+ level in ARPE-19 cells treated with vehicle or OSMI-1. Scale bars = 25 μm. Data are mean ± SD, the p values were obtained using one-way ANNOVA (C, H, J) or unpaired t-test (A, B, I).
Fig. 8
Fig. 8. GRP75 deficiency alleviates RPE dysfunction and AMD progression in vivo.
A Flowchart of the in vivo experiments. B The H&E staining of mice retinas. White triangle: impaired RPE cells; black asterisk: subsidence of outer nuclear layer (ONL). Scale bars = 50 μm. C Retinal OCT and ultra-wide angle en face images obtained from SS-OCTA showing decreased number of punctate hyperreflective signals (red circle: impaired RPE cells or misalignment of the ONL layer) and thicken ONL by administration of AAV8-shGRP75 in the NaIO3-treated mice. D ERG recordings of mice retinas under scotopic condition. E RPE65 and ZO-1 expressions in mice RPE by immunoblot analysis. Quantification of the protein levels relative to β-actin expression is shown. F, G Immunofluorescent staining of RPE65 and ZO-1 in the indicated groups of mice retinas. Scale bars = 50 μm. (NC: staining without primary antibody). H Immunofluorescent staining of photoreceptor functional indicators (Arrestin, Rhodopsin) in the indicated groups of mice retinas. Scale bars = 50 μm. Data are mean ± SD, the p values were obtained using unpaired t-test (CE). *p < 0.05 versus AAV8-vector group.
Fig. 9
Fig. 9. Endoplasmic reticulum-mitochondria coupling prompts ZBP1-mediated RPE cell PANoptosis.
O-GlcNAcylation of GRP75 promotes VDAC1/GRP75/IP3R1 axis formation, facilitating MAMs and mitochondrial Ca2+ overload. The latter leads to mPTP opening and mtDNA release, contributing to ZBP1 activation and RPE cell PANoptosis in AMD (By Figdraw.com).

References

    1. Fleckenstein, M., Schmitz-Valckenberg, S. & Chakravarthy, U. Age-related macular degeneration: a review. JAMA331, 147–157 (2024). - PubMed
    1. Guymer, R. H. & Campbell, T. G. Age-related macular degeneration. Lancet401, 1459–1472 (2023). - PubMed
    1. Datta, S., Cano, M., Ebrahimi, K., Wang, L. & Handa, J. T. The impact of oxidative stress and inflammation on RPE degeneration in non-neovascular AMD. Prog. Retin. Eye Res.60, 201–218 (2017). - PMC - PubMed
    1. Fleckenstein, M. et al. The progression of geographic atrophy secondary to age-related macular degeneration. Ophthalmology125, 369–390 (2018). - PubMed
    1. Yashkin, A. P., Hahn, P. & Sloan, F. A. Introducing anti-vascular endothelial growth factor therapies for AMD did not raise risk of myocardial infarction, stroke, and death. Ophthalmology123, 2225–2231 (2016). - PMC - PubMed

MeSH terms