. 2025 Aug;7(8):1703-1713.
doi: 10.1038/s42255-025-01338-2. Epub 2025 Jul 29.

Conservation and divergence of metabolic phenotypes between patient tumours and matched xenografts

Affiliations

Conservation and divergence of metabolic phenotypes between patient tumours and matched xenografts

Aparna D Rao et al. Nat Metab. 2025 Aug.

Abstract

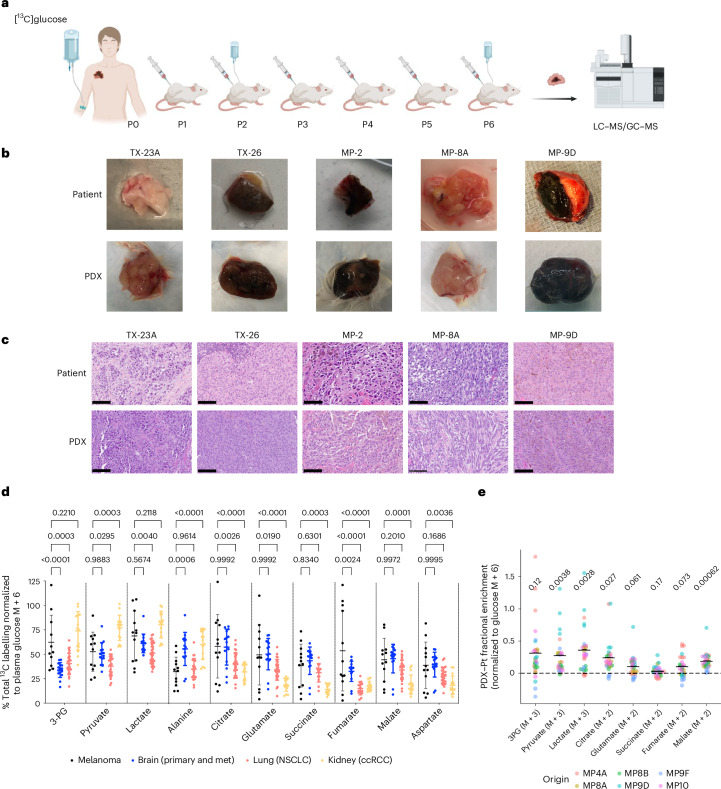
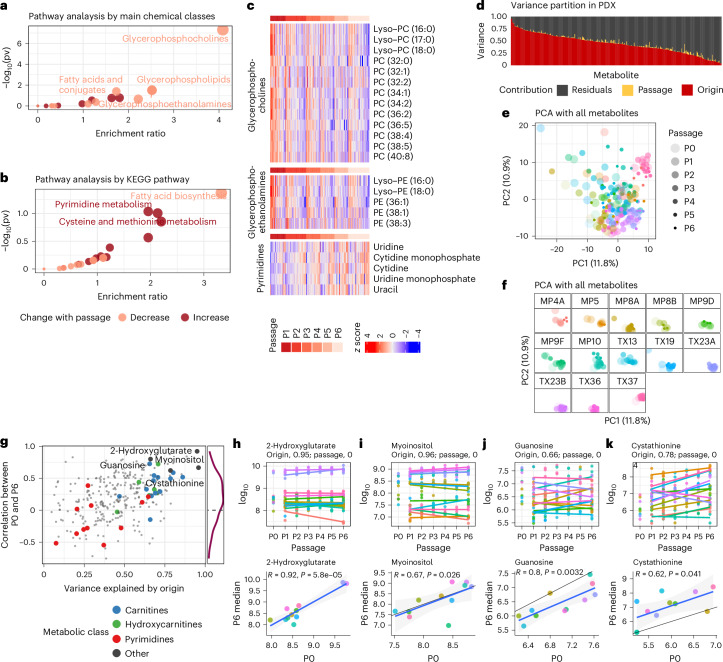
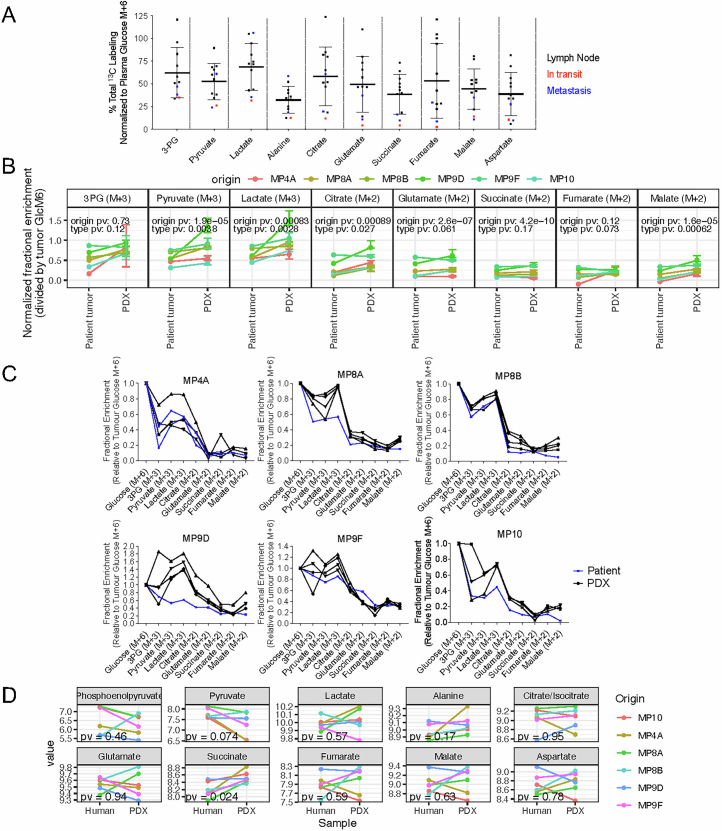
Patient-derived xenografts (PDXs) are frequently used as preclinical models, but their recapitulation of tumour metabolism in patients has not been closely examined. We developed a parallel workflow to analyse [U-13C]glucose tracing and metabolomics data from patient melanomas and matched PDXs. Melanomas from patients have substantial TCA cycle labelling, similar to levels in human brain tumours. Although levels of TCA cycle labelling in PDXs were similar to those in the original patient tumours, PDXs had higher labelling in glycolytic metabolites. Through metabolomics, we observed consistent alterations of 100 metabolites among PDXs and patient tumours that reflected species-specific differences in diet, host physiology and microbiota. Despite these differences, most of nearly 200 PDXs retained a 'metabolic fingerprint' largely durable over six passages and often traceable back to the patient tumour of origin. This study identifies both high- and low-fidelity metabolites in the PDX model system, providing a resource for cancer metabolism researchers.


Conflict of interest statement

Competing interests: B.T. has served on the Squamous Cell Carcinoma Advisory Board for Regeneron. S.J.M. is a founder of Stratus Therapeutics, a consultant to Conception Bio, and a member of the Scientific Advisory Board of Inception Therapeutics. R.J.D. is a founder and advisor at Atavistik Bio and serves on the Scientific Advisory Boards of Agios Pharmaceuticals, Vida Ventures and Faeth Therapeutics. The remaining authors declare no competing interests.

Figures

Fig. 1
Fig. 1. In vivo labelling of human melanoma and matched PDXs infused with [U-13C]glucose.
a, Schematic of a workflow for parallel metabolic analysis of melanomas in patients (P0) and PDXs carried through multiple passages (P1–P6) in mice. LC–MS/GC–MS, liquid chromatography–mass spectrometry and gas chromatography–mass spectrometry. Created using BioRender. b,c, Representative photographs (b) and histology images (c) of tumour samples from patients and matched early passage PDXs. Scale bar = 100 µm. d, Total labelling (1 – (M+0)) of indicated metabolites as analysed by mass spectrometry and normalized to [13C]glucose enrichment (M+6) in patient plasma. Melanoma tumours (n = 12, from 6 patients) from this study were compared with published data from brain, lung and kidney cancer. Data are mean ± s.d. Statistical analysis was done using two-way analysis of variance (ANOVA) with Tukey’s post hoc test; P values are shown. NSCLC, non-small-cell lung cancer; ccRCC, clear cell renal cell carcinoma; met, metastasis. e, Labelling of indicated metabolites normalized to [13C]glucose tumour enrichment, displayed as the absolute difference between the patient (Pt) and P2 or P3 PDXs (n = 27). Each data point represents an individual PDX tumour; midlines mark the mean. P values are shown above each plot for reference, indicating variations in metabolite labelling due to the host type in the two-way ANOVA. Source data
Fig. 2
Fig. 2. Patient tumour xenotransplantation is associated with characteristic metabolic alterations.
a, Univariate association between metabolite levels and tumour type or clinical features. Primary/LN/met, primary, lymph node or met; human/PDX, human or PDX. b, Partition of variance explained in a multivariate model predicting metabolite levels from human/PDX sample type and pigmentation status. c, Volcano plot of metabolites exhibiting different levels in patient and paired P1 PDXs. dg, Selected metabolites with prominent differences between patient and PDX, including microbiota-derived metabolites (d), dietary metabolites (f) and physiology-specific metabolites (e,g). h, Pathway analysis of altered metabolites. i, Heatmap of altered metabolites in enriched pathways. j, Percentage KI-67 staining compared between patient tumours and PDXs of the same origin. The indicated P value was obtained through a two-sided paired t-test. k, Pairwise Euclidean distance between human tumours and PDXs from the same or different patients, calculated on the basis of all metabolites. l, Matching PDX to patient by minimal pairwise Euclidean distance from 144 species-agnostic metabolites. For dg and k, central lines indicate the median value, and boxplots represent the interquartile range (IQR) with whiskers extending to the smallest and largest values within 1.5 times the IQR. Mann–Whitney tests were performed to calculate P values, as described in Methods. n = 36 (18 pairs of matched patient tumour and PDX) for ai; n = 28 (14 pairs) for j; n = 199 (11 patient tumours and 188 PDXs for k and l, see also Extended Data Figure 3c for details).
Fig. 3
Fig. 3. Metabolomic profiling of tumours from serially passaged melanoma PDXs.
a,b, Pathway analysis of the metabolites changed by PDX passaging, as identified through multivariate analysis, from P1 to P6 (from n = 188 samples). For statistical analysis, a hypergeometric test was used without adjustment for multiple comparisons. pv, P value. c, Heatmap of altered metabolites in enriched pathways. Samples in columns are ordered by passage, and within each passage, by the average across selected metabolites, showing concordant changes of metabolites from the same class or pathway. d, Variance partition from a multivariate model predicting PDX metabolite levels by passage and origin. e,f, Principal component analysis (PCA) of patient and PDX samples by all metabolites, with all samples together (e) or separated by origin (f). g, Metabolites with high origin-specific variations (x axis) are also more concordant between patient tumour (P0) and late-passage PDX (P6) (y axis). hk, Detailed examination of selected metabolites (also labelled in g). In each plot, the top panel shows the levels from P0 to P6, with linear regression lines fitted for each PDX line from P1 to P6. The variance contributed by origin or passage are given in the subtitle. Bottom, Pearson correlation between P0 and P6 samples and resulting P values. The black line denotes where x = y, and the blue line is a regression line from a linear fit. Colour denotes origin; see f for the colour key.
Extended Data Fig. 1
Extended Data Fig. 1. 13C enrichment in early passage PDX relative to patient tumors.
(a) Total labeling [1-(M + 0)] of indicated metabolites in melanoma patient tumors normalized to 13C-glucose enrichment (M + 6) in plasma (See Fig. 1d, n = 12, mean ± SD). Note that the samples are colored by the site of tissue procurement, with no obvious difference by site. (b) Each plot shows the 13C enrichment of selected labelled markers normalized to tumor Glucose M + 6, with results for patient tumors (n = 6) and their corresponding PDX samples (n = 27) plotted for comparison, error bars represent upper and lower quartiles. Lines connect samples of the same patient origin, from patient tumor to median of PDX, and each origin type is denoted by a different color. Statistical significance between origins and tumor types (P-values) are shown above each plot for reference, indicating variations in metabolite labeling due to the origin of the PDX lines and the host type in the two-way analysis of variance (ANOVA). (c) Fractional enrichment of indicated metabolites normalized to tumor Glucose M + 6. Note that PDX samples (black, n = 3-4) exhibit higher glycolytic intermediate labeling than the parental patient tumors (blue). (d) Comparison of relative metabolite abundance between tumors and matched PDXs (6 pairs). P-values from two-sided paired t-tests are provided in each plot.
Extended Data Fig. 2
Extended Data Fig. 2. 13C enrichment in early and late passage PDX relative to patient tumors.
(a) Four matched sets of citrate m + 2/pyruvate m + 3 ratios are shown for tumors from: patient, early passage PDX, and late passage PDX. PDX data are mean ± SEM (with each data point representing a mean of 3 values from an individual PDX tumor), n = 3-5, with individual n detailed on the x-axis. P-values were calculated using two-way ANOVA, modeling the labeling ratio as a function of sample type and origin. (b) Each plot shows the 13C enrichment of selected metabolites normalized to tumor Glucose M + 6, with results for early passage (P2 or P3, shown in black) and late passage (P6, shown in grey) PDXs. PDX data are mean ± SEM, with n as follows: MP4A (early passage n = 4, late passage n = 5); MP8A (early passage n = 4, late passage n = 4); MP9D (early passage n = 4, late passage n = 5); MP10 (early passage n = 5, late passage n = 3).
Extended Data Fig. 3
Extended Data Fig. 3. Tumor and PDX pathology analysis.
(a) Quantification of 17 pairs of matched patient/PDX tumors for markers of histology, immune composition, and proliferation. (b) Visualization of comparison of patient tumor pathology features (x-axis) and PDX pathology features (y-axis) by scatterplot with Pearson correlation statistics (N = 18 pairs).
Extended Data Fig. 4
Extended Data Fig. 4. Metabolic contribution to patient-PDX matching.
(a) Heatmap of metabolite-specific contributions to patient-PDX matching. The heatmap displays the Δdk values (difference between matched and average non-matched Euclidean distances) for each of the 143 metabolites across 171 matched patient-PDX pairs. Columns represent metabolites, while rows correspond to individual patient-PDX matches. Metabolites with negative Δdk (blue) contribute to greater similarity in matched pairs, while positive Δdk (red) indicate divergence. The variability in metabolite contributions across pairs reflects heterogeneity in patient-PDX metabolite profiles. (b) Histogram of metabolite contributions to similarity. The histogram summarizes the number of metabolites (Δdk < 0) contributing to greater similarity for each matched patient-PDX pair. The majority of matches exhibit 90–130 metabolites with Δdk < 0, indicating that most non-host-related metabolites play a role in driving patient-PDX resemblance.
Extended Data Fig. 5
Extended Data Fig. 5. Tumor and PDX samples.
Samples (n = 199) characterized by metabolomics in this study include patient tumor (passage 0) and serially passaged PDXs from 13 tumor fragments (left-side y-axis label) in 10 patients (right-side y-axis label).
Extended Data Fig. 6
Extended Data Fig. 6. Signature metabolites cluster samples by lineage.
Top metabolites that explain over 30% of the variance by origin and Pearson correlation > 0.3 between P0 and P6 samples (see Fig. 3d, n = 199 samples) were used in this heatmap. Metabolites and samples are hierarchically clustered into distinctive groups with PDXs from the same origin showing distinctive metabolic patterns. 10 of the 13 patient tumors formed a cluster separate from the rest of the PDX clusters. Note that PDX lines from the same patients - MP8A/B, MP9D/F, and TX23A/B generally cluster together.
Extended Data Fig. 7
Extended Data Fig. 7. Plot of PDX metabolites based on their origin fidelity and stability.
Metabolites are plotted based on origin-specific variations (x-axis) and concordance between patient tumor (P0) and late passage PDX (P6) (y-axis). (summarized from 11 patient tumors and 40 P6 PDX).

References

    1. Liu, Y. et al. Patient-derived xenograft models in cancer therapy: technologies and applications. Signal Transduct. Target Ther.8, 160 (2023). - PMC - PubMed
    1. Woo, X. Y. et al. Conservation of copy number profiles during engraftment and passaging of patient-derived cancer xenografts. Nat. Genet.53, 86–99 (2021). - PMC - PubMed
    1. Cassidy, J. W., Caldas, C. & Bruna, A. Maintaining tumor heterogeneity in patient-derived tumor xenografts. Cancer Res.75, 2963–2968 (2015). - PMC - PubMed
    1. Izumchenko, E. et al. Patient-derived xenografts effectively capture responses to oncology therapy in a heterogeneous cohort of patients with solid tumors. Ann. Oncol.28, 2595–2605 (2017). - PMC - PubMed
    1. Quintana, E. et al. Human melanoma metastasis in NSG mice correlates with clinical outcome in patients. Sci. Transl. Med.4, 159ra149 (2012). - PMC - PubMed

Grants and funding