. 2025 Aug;21(8):e70519.
doi: 10.1002/alz.70519.

Mitochondrial complex I deficiency induces Alzheimer's disease-like signatures that are reversible by targeted therapy

Affiliations

Mitochondrial complex I deficiency induces Alzheimer's disease-like signatures that are reversible by targeted therapy

Huanyao Gao et al. Alzheimers Dement. 2025 Aug.

Abstract

Introduction: Mitochondrial dysfunction is implicated in Alzheimer's disease (AD), but whether it drives AD-associated changes is unclear. We assessed transcriptomic alterations in the brains of Ndufs4-/- mice, a model of mitochondrial complex I (mtCI) deficiency, and evaluated the therapeutic effects of the neuroprotective mtCI inhibitor CP2.

Methods: Cortico-hippocampal tissue from Ndufs4-/- and wild-type mice was subjected to transcriptomic analysis, followed by cross-species comparisons to human late-onset AD and familial AD mouse datasets.

Results: Knockout of Ndufs4-mediated mtCI deficiency disrupted mitochondrial homeostasis, energy metabolism, and synaptic gene expression, recapitulating transcriptomic signatures of AD. CP2 treatment partially reversed these changes, with female Ndufs4-/- mice showing greater compensatory adaptations and treatment responses.

Discussion: Loss of mtCI activity alone is sufficient to induce AD-like molecular changes in the brain, independent of amyloid beta or phosphorylated tau. CP2-mediated rescue highlights the potential of targeting mitochondria as a therapeutic strategy for AD. Sex-specific responses suggest important considerations for personalized therapeutics.

Highlights: Activity of mitochondrial complex I (mtCI) affects broad mitochondrial and neuronal transcriptional networks. A reduction of mtCI activity is sufficient to induce transcriptomic changes reminiscent of those observed in late-onset Alsheimer's disease (AD) patients and familial mouse models of AD. Pharmacological targeting of mtCI mediates neuroprotective signaling. Male and female mice have differential responses to the loss of mtCI activity and to the mitochondria-targeted therapeutics. Mitochondria play a key role in AD development and treatment.

Keywords: Alzheimer's disease; Ndufs4 knockout mice; biological domains; mitochondrial complex I; mitochondria‐targeted therapeutics; mitophagy; sex‐specific differences; sex‐specific response; transcriptomic analysis; ubiquitin; weak complex I inhibitors.


Conflict of interest statement

Dr. Eugenia Trushina and the Mayo Clinic hold four US patents on novel small‐molecule mitochondrion‐targeted compounds. Dr. Cory Funk is a cofounder of Fulcrum Neuroscience. Declarations of interest: None. Author disclosures are available in the supporting information.

Figures

FIGURE 1
FIGURE 1
DEGs in the cortico‐hippocampal tissue of male and female Ndufs4−/− versus WT mice. Volcano plots showing DEGs for (A) female and (B) male mice. The x axis represents the log2‐fold change between Ndufs4−/− and WT mice, and the y axis represents negative log10 p values. The number of significantly changed genes is shown at the top. Red, upregulated genes; blue, downregulated genes. C, Venn diagram showing the overlap between up‐ and downregulated DEGs in female and male mice. D–F, First PC plot of sample‐wise Z score–transformed expression of DEGs for pathways involved in OXPHOS and mitochondrial homeostasis. WT, green; Ndufs4−/− , purple. The directionality of PCs was adjusted to reflect the expression level. Each dot represents one sample. Statistical differences between groups were tested by two‐tailed Student t tests, and p values are shown in the plots. Boxes represent the IQR, and whiskers represent 1.5 × IQR. = 3 for Ndufs4−/− and WT males, = 5 for Ndufs4−/− and WT females. DEG, differentially expressed gene; IQR, interquartile range; OXPHOS, oxidative phosphorylation; PC, principal component; TCA, tricarboxylic acid cycle; WT, wild type.
FIGURE 2
FIGURE 2
CP2 treatment reverses changes in gene expression in the brain tissue of Ndufs4−/− mice. A, CP2 inhibition of mtCI‐specific NADH oxidation in mouse brain mitochondria from WT (black) and Ndufs4−/− (red) mice. The residual activity of mtCI in Ndufs4−/− mice was 50% of the activity in WT mice. B, CP2 inhibited mtCI activity to the same extent in WT and Ndufs4−/− mice. N = 1 male and 1 female, 39 days old per group. C, D, PCA plots of DEGs in female (C) and male (D) Ndufs4−/− and WT mice treated with vehicle or CP2. (E, F) The first PC of samplewise Z score‐transformed DEGs between CP2‐ and vehicle‐treated Ndufs4−/− mice for specific pathways. Red, vehicle; blue, CP2. The directionality of PCs was adjusted to reflect the expression level. Each dot represents one sample. Statistical differences between groups were tested via two‐tailed Student t tests, with p values indicated in the plots. G, Expression of mitochondrial biogenesis genes in CP2‐ and vehicle‐treated Ndufs4−/− mice. Each dot represents one sample. Red, vehicle; blue, CP2. Statistical differences between groups were tested by the GLM using EdgeR; the p values are marked in the plots. Boxes in boxplots represent IQRs, and whiskers represent 1.5 × IQRs. = 3 for the vehicle‐treated Ndufs4−/− and WT male groups; = 5 for the CP2‐treated Ndufs4−/− and WT male groups; n = 5 for all female groups. Assessment of mitochondrial quality in female (H) and male and (I) WT and Ndufs4−/− mice treated with vehicle or CP2 via p‐S65‐Ub labeling. = 8 (3 M/5F) vehicle‐treated WT mice, 9 (4 M/5F) CP2‐treated WT mice, 8 (3 M/5F) vehicle‐treated Ndufs4−/− mice, and 9 (5 M/4F) CP2‐treated Ndufs4−/− mice. Statistical analysis was performed in GraphPad Prism 10.2.3. Two‐way analysis of variance combined with a Tukey test was used to correct for multiple comparisons. *p < 0.05; **p < 0.005; ***p < 0.001. CPM, counts per million; DEG, differentially expressed gene; GLM, general linear model; mtCI, mitochondrial complex I; OXPHOS, oxidative phosphorylation; PC, principal component; PCA, principal component analysis; TCA, tricarboxylic acid cycle; WT, wild type.
FIGURE 3
FIGURE 3
WGCNA of DEGs in Ndufs4−/− mice. A–C, Seventeen coexpression modules were built via the WGCNA program. The module names and colors are labeled on the left, and the primary pathways of genes in each module are labeled on the right. Associations between different groups were compared by calculating the eigengenes of each sample. Statistical differences between groups were tested via two‐tailed Student t tests, with p values labeled and colored as heatmaps (red, upregulated; blue, downregulated). Comparison pairs are labeled at the top. B, C, Heatmaps of z score–normalized expression across samples for modules significantly different between at least one group of comparisons, as shown in (B) female and (C) male mice. Each row represents a gene, and each column represents a sample. Module labels (left) and primary pathways (right) are shown for each module. The expression of each gene was Z score normalized across all samples. BDNF, brain‐derived neurotrophic factor; ECM, extracellular matrix; EPHR, glutamatergic synapse/erythrin receptor; mTOR, mammalian target of rapamycin; TNFa, tumor necrosis factor alpha; WGCNA, weighted gene coexpression network analysis; WT, wild type.
FIGURE 4
FIGURE 4
Overlap between AMP‐AD aggregated coexpression modules and DEGs in CP2‐ or vehicle‐treated Ndufs4−/− and WT mice. A, Concordance between AMP‐AD aggregated coexpression modules and DEGs from representative AD mouse models, as indicated at the bottom. Color bar on the left: AMP‐AD aggregated coexpression clusters. Labels on the right: AMP‐AD aggregated coexpression modules. Color bar on top: pink (humanized APP/PS1 transgenic mice); orange (MAPT knock‐in model mice). The darkness of the heatmap represents the log10 enrichment false‐discovery rate adjusted p values: red indicates that concordance is more significant in the positive direction, and blue indicates that concordance is more significant in the negative direction. B, The overlap concordance between the AMP‐AD aggregated coexpression modules and DEGs from Ndufs4−/− mice. The AMP‐AD clusters (color bar on the left) and modules (labels on the right), and the concordance color scale are the same as those in (A). The DEG analysis pairs for each column are labeled on top. Concordance was calculated for Ndufs4−/− versus WT columns and for CP2 versus vehicle‐treated columns (see Methods). AD, Alzheimer's disease; AMP‐AD, Accelerating Medicines Partnership in Alzheimer's Disease; DEG, differentially expressed gene; WT, wild type.
FIGURE 5
FIGURE 5
Analysis of the overlap between the AMP‐AD modules and DEGs in Ndufs4−/− mice. Fold change in the expression of DEGs between AD and normal samples in the AMP‐AD CBEturquoise (A), DLPFCyellow (F), and PHGblue (K) modules that overlap concordantly with the DEGs of Ndufs4−/− versus WT male and female mice. Each dot represents a gene. First PC of samplewise Z score–transformed DEGs of Ndufs4−/− versus WT mice concordantly overlapped with the AMP‐AD CBEturquoise (B), DLPFCyellow (G), and PHGblue (L) modules, colored by mouse genotype (WT, green; Ndufs4−/− , purple) and grouped by sex. The directionality of the PCs was adjusted to reflect the expression level. First PC of samplewise Z score–transformed DEGs of CP2‐ versus vehicle‐treated Ndufs4−/− mice that discordantly overlapped with AMP‐AD CBEturquoise (C), DLPFCyellow (G), or PHGblue (K) modules, colored by treatment (vehicle, red; CP2, blue) and grouped by sex. The directionality of PCs was adjusted to reflect the expression level. For all boxplots, each dot represents one sample. Statistical differences between groups were tested via two‐tailed Student t tests, with p values marked in the plots. Boxes represent the IQR, and whiskers represent 1.5 × IQR. = 3 for vehicle‐treated Ndufs4−/− males; = 5 for all other groups. Pathway analysis of overlapping genes between DEGs of the AMP‐AD CBEturquoise module (D) for females, the CBEturquoise module (E) for males, the DLPFCyellow module (I) for females, the DLPFCyellow module (J) for males, the PHGblue module (N) for females, the PHGblue module (O) for males, and the Ndufs4−/− versus WT mouse DEGs (concordantly) or the CP2 versus vehicle mouse DEGs (discordantly) via the Enrichr database. The x axis represents negative log p values of pathway enrichment, and the color ramp represents the percentage of genes matched for a specific pathway. AD, Alzheimer's disease; AMP‐AD, Accelerating Medicines Partnership in Alzheimer's Disease; DEG, differentially expressed gene; IQR, interquartile range; PC, principal component; WT, wild type.
FIGURE 6
FIGURE 6
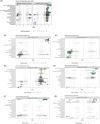
Comparison of the transcriptomes of male and female Ndufs4−/− mice with the human late‐onset AD transcriptome. The DEGs for (A) male and (B) female Ndufs4−/− mice compared to sex‐matched wild‐type controls intersected with the DEGs from the harmonized LOAD transcriptome. The blue line (lower left) of each Venn diagram shows the number of downregulated genes shared between datasets, whereas the red line shows the upregulated genes common to both datasets. GSEA was performed on each intersection for Reactome, KEGG, and GO (BP), and the top 10 values are reported within the bar graphs on the left and right. The left‐hand bars show the enrichment of the downregulated DEGs, whereas the right‐hand bars show the enrichment of the upregulated DEGs. The results with an asterisk are significant at an FDR of <0.05, and the negative log of the uncorrected p value is shown on the x axis. AD, Alzheimer's disease; BP, Biological Process; DEG, differentially expressed gene; FDR, false discovery rate; GO, Gene Ontology; GSEA, gene set enrichment analysis; KEGG, Kyoto Encyclopedia of Genes and Genomes; LOAD, late‐onset Alzheimer's disease.
FIGURE 7
FIGURE 7
AD biological domain enrichment in Ndufs4−/− and CP2‐treated male and female mice. The AD biological domains represent endophenotypes associated with AD rendered computationally accessible through GO term associations (see Methods). Varying analyses were performed to harness statistical power within the samples. Gene set enrichment analysis was performed between the experimental and control groups to examine genetic (Ndufs4−/− vs. WT littermate controls), treatment (CP2 vs. vehicle), and sex (male or female Ndufs4−/− vs. male or female WT controls, respectively) differences. The top analysis performed in (A) shows the effects of either the NDUFS4 gene or CP2 treatment across all groups. On the left, the effects of Ndufs4 deletion were examined by collapsing male and female mice together. On the right, the effects of CP2 treatment on the transcriptome are shown across genotypes. The genetic data were broken down into male (left) and female (right) data for subsequent analysis. B, C, Male and female shifts in expression within each biological domain upon Ndufs4 deletion. D, E, Effects of CP2 treatment on Ndufs4−/− male (D) and female (E) mice relative to WT control mice. The bottom plots show the impact of CP2 treatment on WT (F) male and (G) female mice. AD, Alzheimer's disease; GO, Gene Ontology; WT, wild type.
FIGURE 8
FIGURE 8
Summary of the sex‐specific response of Ndufs4−/− mice to reduced mtCI activity, the development of AD‐like transcriptomic signatures, and CP2 treatment. AD, Alzheimer's disease; mtCI, mitochondrial complex I; OXPHOS, oxidative phosphorylation; PC, principal component; PCA, principal component analysis; TCA, tricarboxylic acid cycle.

References

    1. Beason‐Held LL, Goh JO, An Y, et al. Changes in brain function occur years before the onset of cognitive impairment. J Neurosci. 2013;33:18008‐18014. - PMC - PubMed
    1. Yadollahikhales G, Rojas JC. Anti‐amyloid immunotherapies for Alzheimer's disease: a 2023 clinical update. Neurotherapeutics. 2023;20:914‐931. - PMC - PubMed
    1. Cunnane SC, Trushina E, Morland C, et al. Brain energy rescue: an emerging therapeutic concept for neurodegenerative disorders of ageing. Nat Rev Drug Discov. 2020;19:609‐633. - PMC - PubMed
    1. Swerdlow RH. The Alzheimer's disease mitochondrial cascade hypothesis: a current overview. J Alzheimers Dis. 2023;92:751‐768. - PubMed
    1. Sonntag KC, Ryu WI, Amirault KM, et al. Late‐onset Alzheimer's disease is associated with inherent changes in bioenergetics profiles. Sci Rep. 2017;7:14038. - PMC - PubMed

Substances

Supplementary concepts

LinkOut - more resources