. 2025 Jul 29;24(1):208.
doi: 10.1186/s12943-025-02408-5.

Targeting FGFR4 abrogates HNF1A-driven metastasis in pancreatic ductal adenocarcinoma

Affiliations

Targeting FGFR4 abrogates HNF1A-driven metastasis in pancreatic ductal adenocarcinoma

Katherine J Crawford et al. Mol Cancer. .

Abstract

Background: We previously identified an oncogenic role for the transcription factor HNF1A in pancreatic ductal adenocarcinoma (PDAC). However, the role of HNF1A in the metastatic progression of PDAC remains unknown and targeting modalities for HNF1A-dependent phenotypes have yet to be identified.

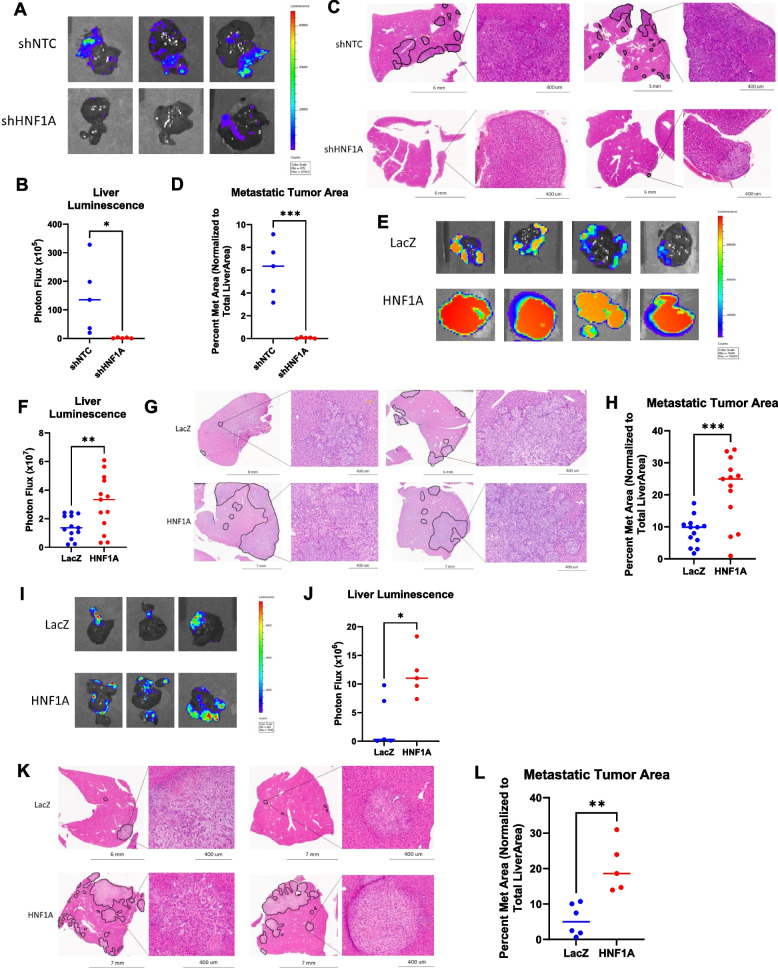
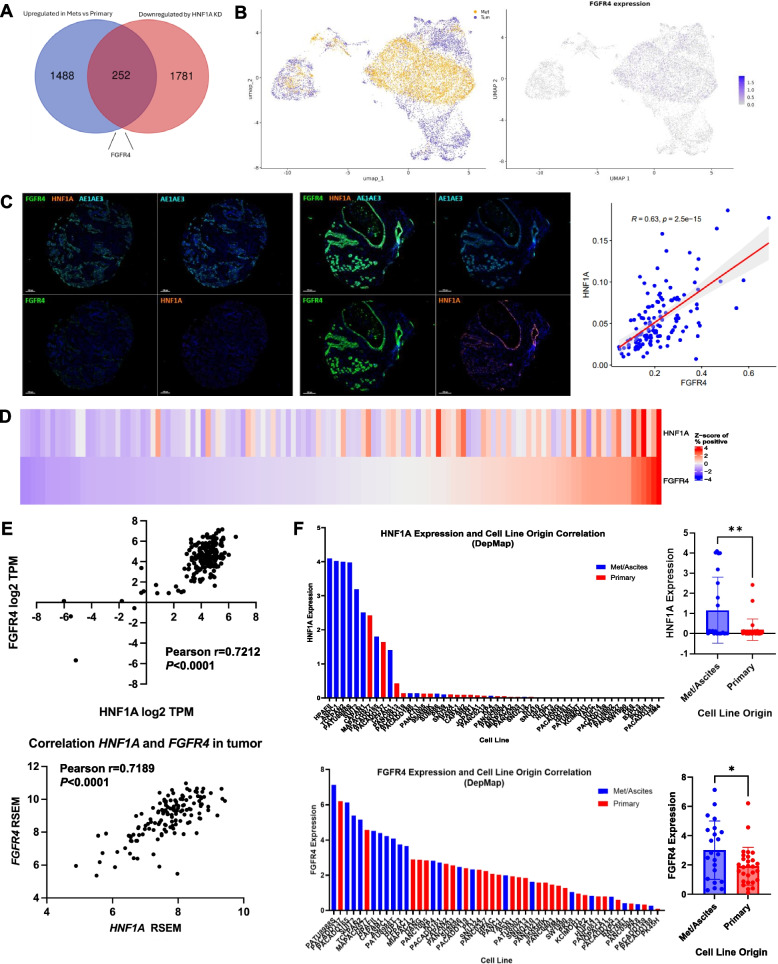
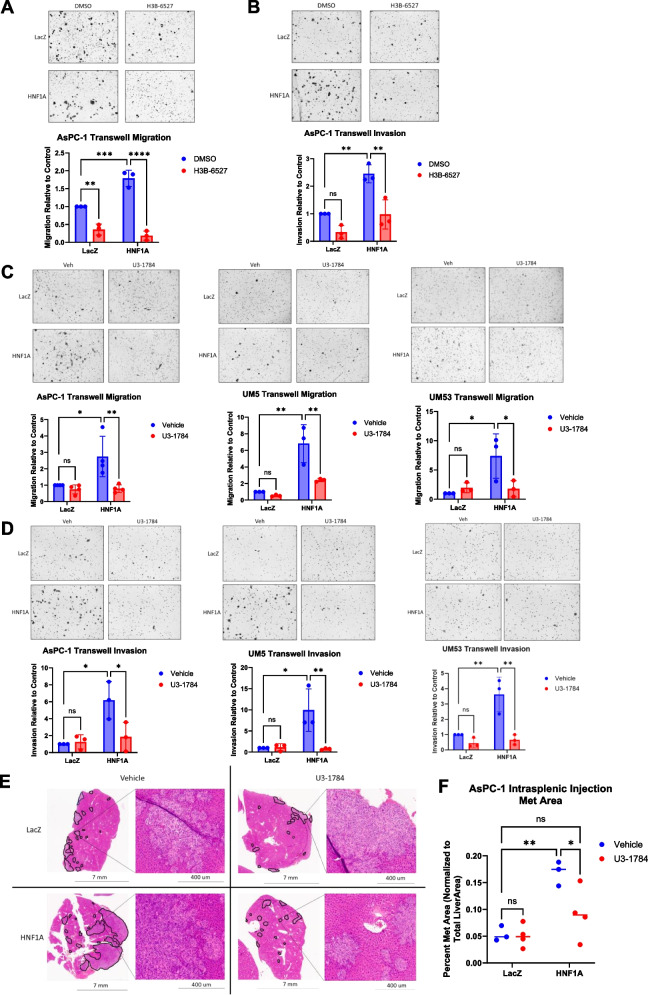
Methods: Transwell chambers were used to assess the effects of HNF1A and FGFR4 modulation on the migration and invasion of ATCC and patient-derived PDAC cells in vitro. An intrasplenic injection xenograft model was used to evaluate the impact of HNF1A knockdown and overexpression on metastatic tumor burden. Single-cell RNA sequencing (scRNA-seq), tissue microarray (TMA) data, and UMAP spatial profiling were used to identify FGFR4 as an HNF1A target gene upregulated in metastatic cells. RNAi and two FGFR4 inhibiting modalities (H3B-6527 and U3-1784) were utilized to demonstrate the efficacy of FGFR4 inhibiting agents at reducing HNF1A-driven metastasis.

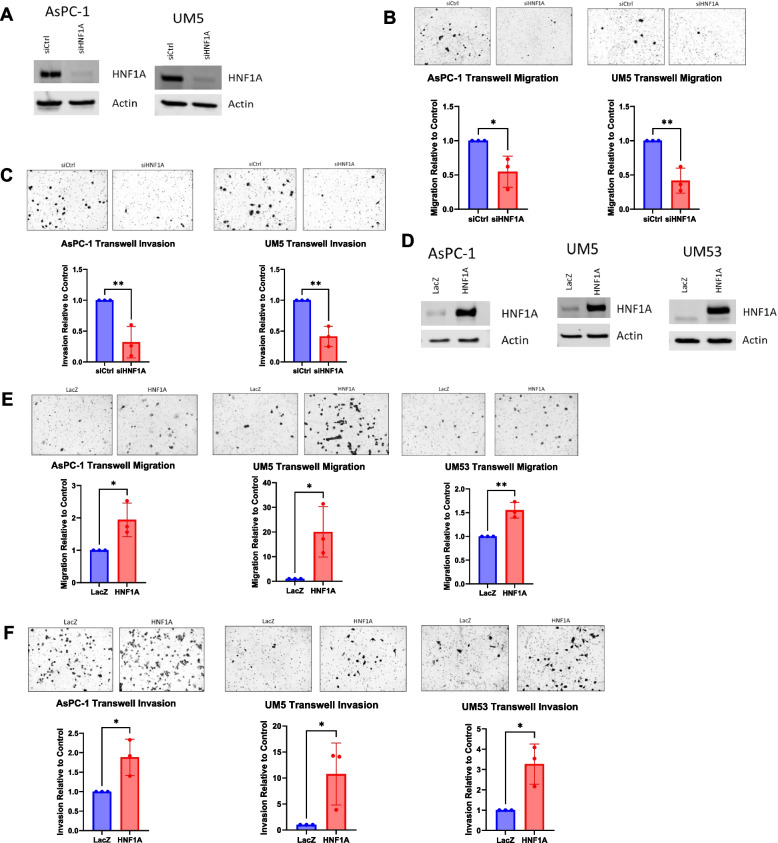
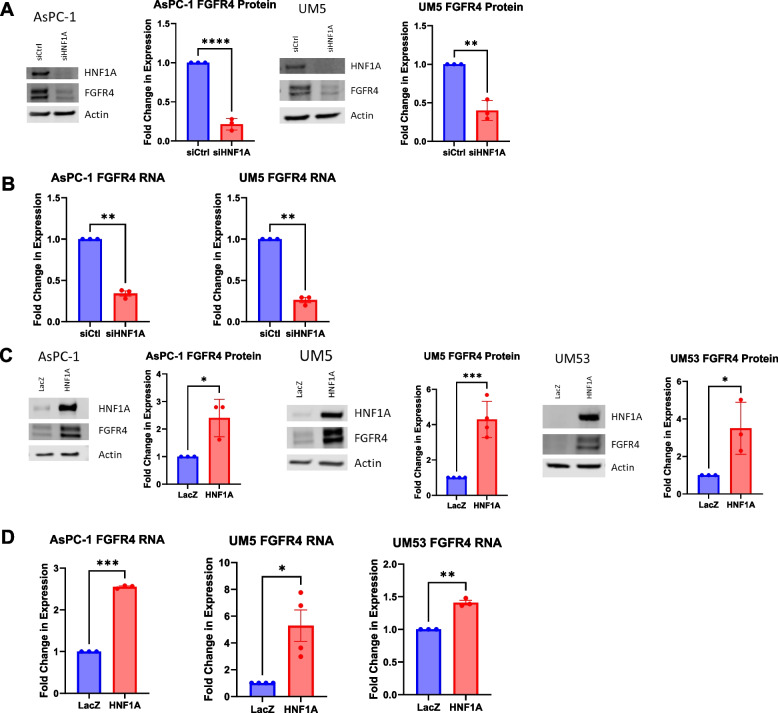
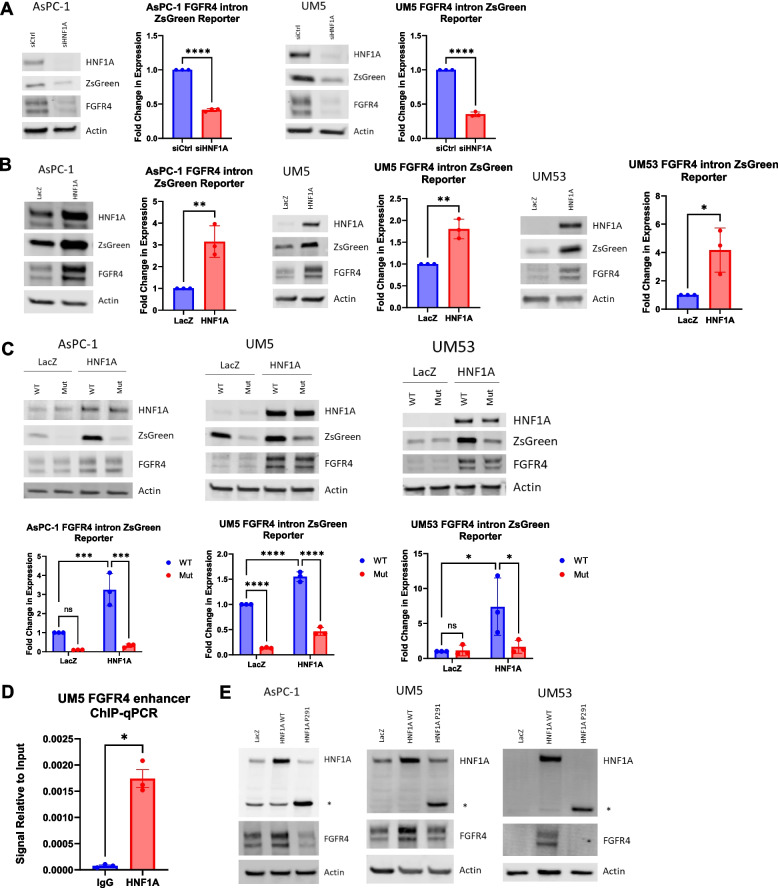
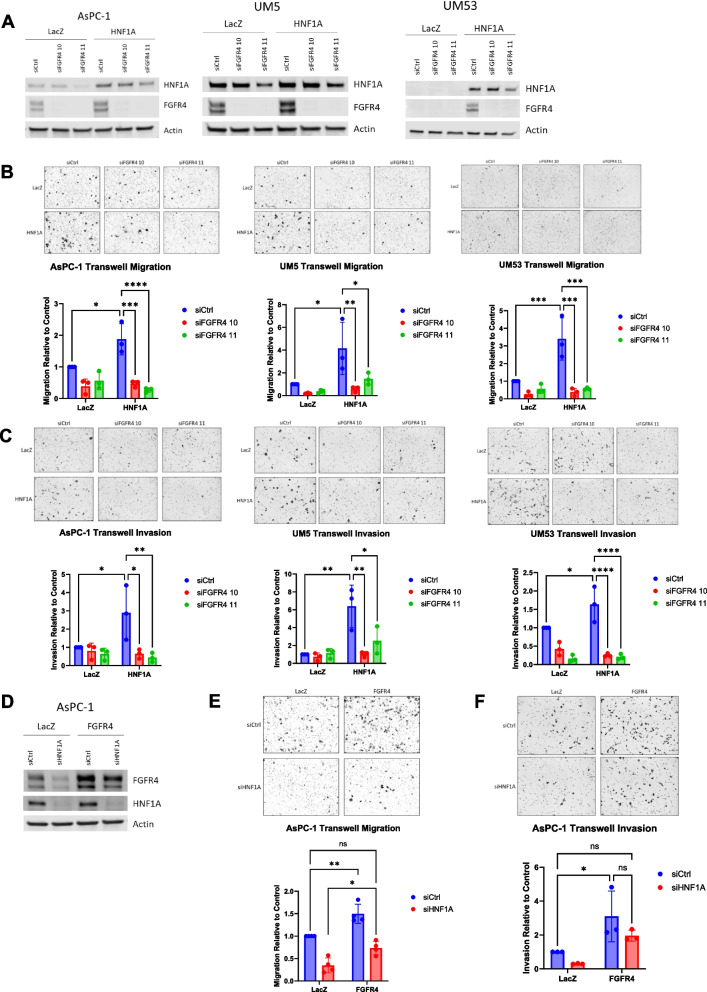
Results: Knockdown of HNF1A significantly decreases and HNF1A overexpression significantly increases PDAC cell migration and invasion. In vivo studies show that HNF1A knockdown significantly abrogates metastasis, while overexpression significantly promotes metastasis. scRNA-seq shows that FGFR4 is upregulated in metastatic PDAC cells and staining for HNF1A and FGFR4 in a PDAC TMA reveals significant correlation between HNF1A and FGFR4 in PDAC patients. Further, knockdown and inhibition of FGFR4 significantly decreases HNF1A-mediated cell migration and invasion, and blocks HNF1A-driven metastasis in vivo.

Conclusions: These findings demonstrate that HNF1A drives PDAC metastasis via upregulation of FGFR4, and FGFR4 inhibition is a potential mechanism to target metastasis in PDAC patients.

Keywords: FGFR4; FGFR4 inhibitors; HNF1A; Metastasis; PDAC; Pancreatic ductal adenocarcinoma.


Conflict of interest statement

Declarations. Ethics approval and consent to participate: The TMA was obtained under an Institutional Review Board approved protocol at Thomas Jefferson University23,24. All animal protocols were approved by The Institute Animal Care and Use Committee (IACUC) at Roswell Park Comprehensive Cancer Center. The animal welfare assurance number for this study is A3143-01. Consent for publication: Not applicable. Competing interests: The authors declare no competing interests.

Figures

Fig. 1
Fig. 1
HNF1A promotes PDAC cell migration and invasion. A Western blotting for HNF1A in AsPC-1 and UM5 cell lines to confirm knockdown. B Normalized quantification and representative images of cell migration with HNF1A knockdown (n = 3 biological replicates). Control knockdown or HNF1A knockdown cells were plated in transwell migration chambers and cells that had migrated after 24 h were fixed and stained for counting. C Normalized quantification and representative images of cell invasion with HNF1A knockdown (n = 3 biological replicates). Control knockdown or HNF1A knockdown cells were plated in transwell invasion chambers and cells that had invaded after 48 h were fixed and stained for counting. D Western blotting for HNF1A in AsPC-1, UM5, and UM53 cells lines to confirm overexpression of HNF1A. E Normalized quantification and representative images of cell migration with HNF1A overexpression (n = 3 biological replicates). LacZ or HNF1A overexpressing cells were plated in transwell migration chambers and cells that had migrated after 6–24 h were fixed and stained for counting. F Normalized quantification and representative images of cell invasion with HNF1A overexpression (n = 3 biological replicates). LacZ or HNF1A overexpressing cells were plated in transwell invasion chambers and cells that had migrated after 24–48 h were fixed and stained for counting. All bar graphs represent the mean ± SEM and statistical difference was determined by unpaired t-test
Fig. 2
Fig. 2
HNF1A drives PDAC liver metastasis in vivo. A Representative bioluminescent images of harvested livers from mice implanted with control and HNF1A knockdown cells. B Quantification of photon flux from bioluminescent images from all harvested livers at endpoint (n = 5 mice per group). C Representative images of H&E stained sections of liver tissue from both control and HNF1A knockdown groups. Black outlines indicate metastatic tissue. Zoomed in insets show histology of metastatic lesions. D Quantification of total metastatic tumor area normalized as a percentage of total liver area (n = 5 mice per group). E Representative bioluminescent images of harvested livers from mice implanted with LacZ and HNF1A overexpressing cells. F Quantification of photon flux from bioluminescent images from all harvested livers at endpoint (n = 13 mice per group). G Representative images of H&E stained sections of liver tissue from both LacZ and HNF1A overexpression groups. Black outlines indicate metastatic tissue. Zoomed in insets show histology of metastatic lesions. H Quantification of total metastatic tumor area normalized as a percentage of total liver area (n = 13 mice per group). I Representative bioluminescent images of harvested livers from mice implanted with LacZ and HNF1A overexpressing cells. J Quantification of photon flux from bioluminescent images from all harvested livers at endpoint (n = 6 mice per group). K Representative images of H&E stained sections of liver tissue from both LacZ and HNF1A overexpression groups. Black outlines indicate metastatic tissue. Zoomed in insets show histology of metastatic lesions. L Quantification of total metastatic tumor area normalized as a percentage of total liver area (n = 6 mice per group). All bar graphs represent the mean and statistical difference was determined by unpaired t-test. *A-H: AsPC-1; I-L: UM53
Fig. 3
Fig. 3
HNF1A and FGFR4 are associated with human metastatic PDAC. A Venn diagram comparison of genes upregulated in metastatic tumors vs primary tumors from GSE253260 and genes significantly downregulated with HNF1A knockdown in AsPC-1 cells. B Left: UMAP plotting of single cell RNA-sequencing showing spatial grouping of primary (purple) and metastatic (yellow) cells. Right: UMAP plotting FGFR4 expression in all single cells. C Left: TMA core demonstrating negativity for both HNF1A and FGFR4 with only staining for pan-cytokeratin. Middle: TMA core showing strong co-staining for all markers. Right: Scatter plot comparing HNF1A and FGFR4 average staining intensity from multispectral immunofluorescent staining of PDAC TMA. D Hierarchical organization of staining positivity of individual cores from multispectral immunofluorescent staining of PDAC TMA based on HNF1A and FGFR4 positivity. E Correlation of HNF1A and FGFR4 RNA expression in patient tumors from the European Genome Phenome Archive (top) and CPTAC (bottom) datasets. F Left: Plotting of all PDAC cell lines available in DepMap Portal based on either HNF1A (top) or FGFR4 (bottom) expression and whether the cell line is derived from primary tumors (red) or metastatic tumors/ascites (blue). Right: Comparison of primary vs metastasis derived cell lines based on the HNF1A (top) or FGFR4 (bottom) expression. Bar graphs represent the mean ± SEM and statistical difference was determined by unpaired t-test
Fig. 4
Fig. 4
HNF1A regulates FGFR4 expression. A Western blotting for HNF1A and FGFR4, and respective quantification of FGFR4 (n = 3 biological replicates), with HNF1A knockdown in AsPC-1 and UM5 cell lines. B Quantitative RT-PCR analysis of FGFR4 RNA levels 72 h after HNF1A knockdown in AsPC-1 and UM5 cell lines (n = 3 biological replicates). C Western blotting for HNF1A and FGFR4, and respective quantification of FGFR4 (n = 3 biological replicates), with HNF1A overexpression in AsPC-1, UM5, and UM53 cell lines. D Quantitative RT-PCR analysis of FGFR4 RNA levels with HNF1A overexpression in AsPC-1, UM5, and UM53 cell lines (n = 3 biological replicates). All bar graphs represent the mean ± SEM and statistical difference was determined by unpaired t-test
Fig. 5
Fig. 5
HNF1A directly binds to the FGFR4 enhancer. A Western blotting for HNF1A, FGFR4, and ZsGreen1 expression, and respective quantification of ZsGreen1 (n = 3 biological replicates), in a reporter system with ZsGreen1 under the control of the FGFR4 enhancer with HNF1A knockdown in AsPC-1 and UM5 cell lines. B Western blotting for HNF1A, FGFR4, and ZsGreen1 expression, and respective quantification of ZsGreen1 (n = 3 biological replicates), in a reporter system with ZsGreen1 under the control of the FGFR4 enhancer with HNF1A overexpression in AsPC-1, UM5, and UM53 cell lines. C Western blotting of HNF1A, FGFR4, and ZsGreen1, and respective quantification of ZsGreen1 (n = 3 biological replicates), in the above reporter system with HNF1A overexpression ± mutation of the HNF1A binding motif in the FGFR4 enhancer in AsPC-1, UM5, and UM53 cell lines. D ChIP-PCR was performed on UM5 cells using normal IgG or BRD4 antibody. E Western blotting for HNF1A and FGFR4 with overexpression of wild-type (WT) HNF1A and HNF1A with a mutant and inactive transactivation domain (P291). All bar graphs represent the mean ± SEM. Statistical difference was determined by unpaired t-test when comparing 2 conditions and two-way ANOVA with Tukey’s multiple comparisons test when comparing 4 conditions
Fig. 6
Fig. 6
FGFR4 promotes migration and invasion downstream of HNF1A. A Western blotting for HNF1A and FGFR4 to confirm HNF1A overexpression and FGFR4 knockdown in AsPC-1, UM5, and UM53 cell lines. B Normalized quantification and representative images of cell migration in both LacZ and HNF1A overexpressing sublines with FGFR4 knockdown (n = 3 biological replicates). Control or FGFR4 knockdown cells were plated in transwell migration chambers and cells that had migrated after 6–24 h were fixed and stained for counting. C Normalized quantification and representative images of cell invasion in both LacZ and HNF1A overexpressing sublines with FGFR4 knockdown (n = 3 biological replicates). Control or FGFR4 knockdown cells were plated in transwell invasion chambers and cells that had migrated after 24–48 h were fixed and stained for counting. D Western blotting for HNF1A and FGFR4 to confirm FGFR4 overexpression and HNF1A knockdown in AsPC-1 cells. E Normalized quantification and representative images of cell migration in both LacZ and FGFR4 overexpressing sublines with HNF1A knockdown (n = 4 biological replicates). Control or FGFR4 knockdown cells were plated in transwell migration chambers and cells that had migrated after 24 h were fixed and stained for counting. F Normalized quantification and representative images of cell invasion in both LacZ and FGFR4 overexpressing sublines with HNF1A knockdown (n = 3 biological replicates). Control or FGFR4 knockdown cells were plated in transwell invasion chambers and cells that had migrated after 48 h were fixed and stained for counting. All bar graphs represent the mean ± SEM and statistical difference was determined by two-way ANOVA with Tukey’s multiple comparisons test
Fig. 7
Fig. 7
Pharmacologic inhibition of FGFR4 reduces HNF1A-driven metastasis. A Normalized quantification and representative images of cell migration in both LacZ and HNF1A overexpressing sublines of AsPC-1 cells treated with 1 μM H3B-6527 (n = 3 biological replicates). DMSO or H3B-6527 treated cells were plated in transwell migration chambers in serum free media containing DMSO or H3B-6527 and cells that had migrated after 24 h were fixed and stained for counting. B Normalized quantification and representative images of cell invasion in both LacZ and HNF1A overexpressing sublines of AsPC-1 cells treated with 1 μM H3B-6527 (n = 3 biological replicates). DMSO or H3B-6527 treated cells were plated in transwell invasion chambers in serum free media containing DMSO or H3B-6527 and cells that had migrated after 48 h were fixed and stained for counting. C Normalized quantification and representative images of cell migration in both LacZ and HNF1A overexpressing sublines of AsPC-1, UM5, and UM53 cells treated with 5 μg/mL U3-1784 (n = 4 biological replicates). Vehicle or U3-1784 treated cells were plated in transwell migration chambers in serum free media containing vehicle or U3-1784 and cells that had migrated after 24 h were fixed and stained for counting. D Normalized quantification and representative images of cell invasion in both LacZ and HNF1A overexpressing sublines of AsPC-1, UM5, and UM53 cells treated with 5 μg/mL U3-1784 (n = 3 biological replicates). Vehicle or U3-1784 treated cells were plated in transwell invasion chambers in serum free media containing vehicle or U3-1784 and cells that had migrated after 48 h were fixed and stained for counting. E Representative images of H&E stained sections of liver tissue from both LacZ and HNF1A groups with either vehicle or U3-1784 treatment. Black outlines indicate metastatic tissue. Zoomed in insets show histology of metastatic lesions. F Quantification of total metastatic tumor area normalized as a percentage of total liver area (n = 3 mice per group for vehicle treated, 4 mice per group for U3-1784 treated). All bar graphs represent the mean ± SEM and statistical difference was determined by two-way ANOVA with Tukey’s multiple comparisons test

Update of

References

    1. Cancer Stat Facts: Pancreatic Cancer. (n.d.). Retrieved from National Cancer Institute Surveillance, Epidemiology, and End Results Program: https://seer.cancer.gov/statfacts/html/pancreas.html
    1. Kleeff J, et al. Pancreatic cancer Nat Rev Dis Prim. 2016;2:1–23. - PubMed
    1. Odom DT, et al. Control of pancreas and liver gene expression by HNF transcription factors. Science. 2004;303(5662):1378–81. - PMC - PubMed
    1. Servitja J-M, et al. Hnf1 (MODY3) Controls Tissue-Specific Transcriptional Programs and Exerts Opposed Effects on Cell Growth in Pancreatic Islets and Liver †. Mol Cell Biol. 2009;29:2945–59. - PMC - PubMed
    1. Valkovicova T, Skopkova M, Stanik J, Gasperikova D. Novel insights into genetics and clinics of the HNF1A-MODY. Endocr Regul. 2019;53:110–34. - PubMed

MeSH terms

Substances

LinkOut - more resources