. 2025 Jul 14;18(14):3306.
doi: 10.3390/ma18143306.

Influence of Zn Content on the Corrosion and Mechanical Properties of Cast and Friction Stir-Welded Al-Si-Mg-Fe-Zn Alloys

Affiliations

Influence of Zn Content on the Corrosion and Mechanical Properties of Cast and Friction Stir-Welded Al-Si-Mg-Fe-Zn Alloys

Xiaomi Chen et al. Materials (Basel). .

Abstract

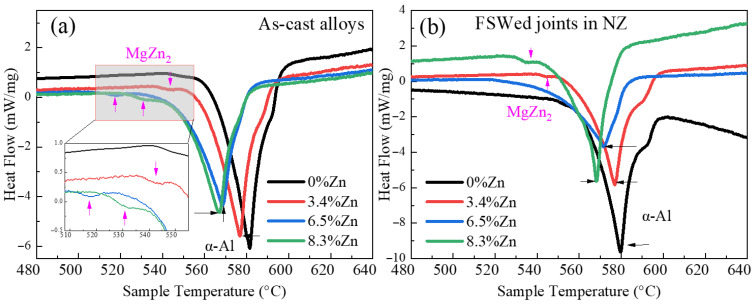
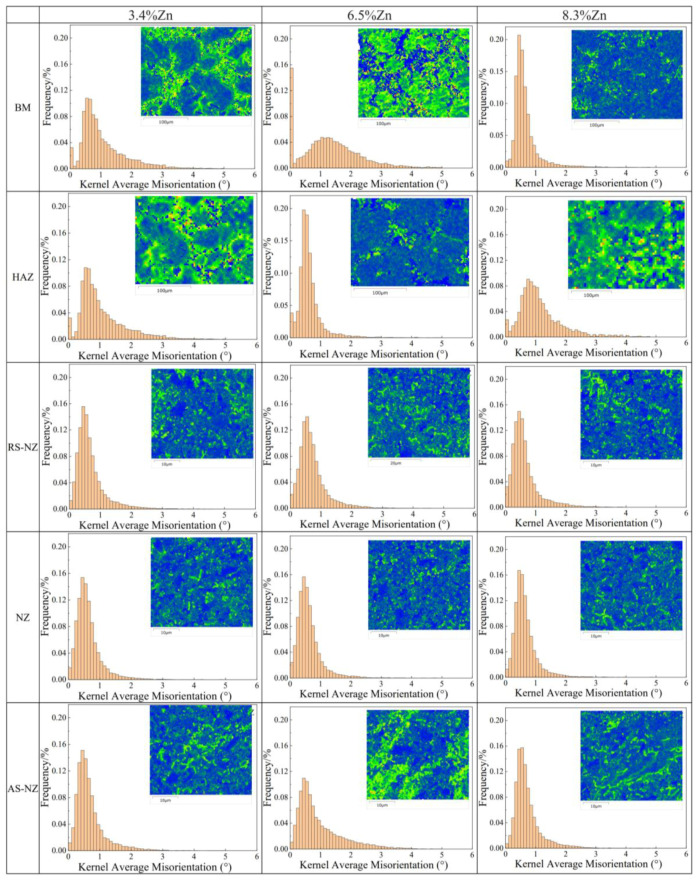
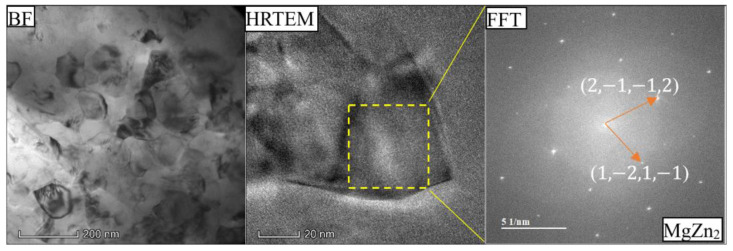
With the ongoing development of lightweight automobiles, research on new aluminum alloys and welding technology has gained significant attention. Friction stir welding (FSW) is a solid-state joining technique for welding aluminum alloys without melting. In this study, novel squeeze-cast Al-Si-Mg-Fe-Zn alloys with different Zn contents (0, 3.4, 6.5, and 8.3 wt%) were friction stir welded (FSWed) at a translational speed of 200 mm/min and a rotational speed of 800 rpm. These parameters were chosen based on the observations of visually sound welds, defect-free and fine-grained microstructures, homogeneous secondary phase distribution, and low roughness. Zn can affect the microstructure of Al-Si-Mg-Fe-Zn alloys, including the grain size and the content of secondary phases, leading to different mechanical and corrosion behavior. Adding different Zn contents with Mg forms the various amount of MgZn2, which has a significant strengthening effect on the alloys. Softening observed in the weld zones of the alloys with 0, 3.4, and 6.5 wt% Zn is primarily attributed to the reduction in Kernel Average Misorientation (KAM) and a decrease in the Si phase and MgZn2. Consequently, the mechanical strengths of the FSWed joints are lower as compared to the base material. Conversely, the FSWed alloy with 8.3 wt% Zn exhibited enhanced mechanical properties, with hardness of 116.3 HV0.2, yield strength (YS) of 184.4 MPa, ultimate tensile strength (UTS) of 226.9 MP, percent elongation (EL%) of 1.78%, and a strength coefficient exceeding 100%, indicating that the joint retains the strength of the as-cast one, due to refined grains and more uniformly dispersed secondary phases. The highest corrosion resistance of the FSWed alloy with 6.5%Zn is due to the smallest grain size and KAM, without MgZn2 and the highest percentage of {111} texture (24.8%).

Keywords: Al-Si-Mg-Fe-Zn alloys; corrosion resistance; friction stir welding; mechanical properties; microstructure.


Conflict of interest statement

The authors declare no conflicts of interest.

Figures

Figure 28
Figure 28
Corrosion mechanism of Al-Si-Mg-Fe-Zn alloys (a) before and (b) after corrosion test.
Figure A1
Figure A1
SEM images and EDS maps of as-cast alloys.
Figure A1
Figure A1
SEM images and EDS maps of as-cast alloys.
Figure A1
Figure A1
SEM images and EDS maps of as-cast alloys.
Figure A2
Figure A2
EDS maps of Al, Si, Sr, Mg, Fe, Zn and Ti of different regions of cross-sectional microstructures of the FSWed joint of Al-Si-Mg-Fe-3.4%Zn.
Figure A2
Figure A2
EDS maps of Al, Si, Sr, Mg, Fe, Zn and Ti of different regions of cross-sectional microstructures of the FSWed joint of Al-Si-Mg-Fe-3.4%Zn.
Figure A3
Figure A3
EDS maps of Al, Si, Sr, Mg, Fe, Zn and Ti of different regions of cross-sectional microstructures of the FSWed joint of Al-Si-Mg-Fe-6.5%Zn.
Figure A3
Figure A3
EDS maps of Al, Si, Sr, Mg, Fe, Zn and Ti of different regions of cross-sectional microstructures of the FSWed joint of Al-Si-Mg-Fe-6.5%Zn.
Figure A4
Figure A4
EDS maps of Al, Si, Sr, Mg, Fe, Zn, and Ti of different regions of cross-sectional microstructures of the FSWed joint of Al-Si-Mg-Fe-8.3%Zn.
Figure A4
Figure A4
EDS maps of Al, Si, Sr, Mg, Fe, Zn, and Ti of different regions of cross-sectional microstructures of the FSWed joint of Al-Si-Mg-Fe-8.3%Zn.
Figure 1
Figure 1
Setup for FSW.
Figure 2
Figure 2
Dimensions of the specimens for tensile tests (in mm).
Figure 3
Figure 3
DSC curves of (a) as-cast specimens and (b) NZ of FSWed joint.
Figure 4
Figure 4
FSWed joints of (a) Al-Si-Mg-Fe-0%Zn, (b) Al-Si-Mg-Fe-3.4%Zn, (c) Al-Si-Mg-Fe-3.4%Zn, and (d) Al-Si-Mg-Fe-8.3%Zn.
Figure 5
Figure 5
Cross-sectional microstructures of FSWed Al-Si-Mg-Fe-0%Zn; (a) overall view; (b) NZ-KAM, (c) NZ-BC + IPF||Z + GB, (d) NZ-frequency map of KAM, (e) BM-KAM, (f) BM-BC + IPF||Z + GB, (g) BM-frequency map of KAM.
Figure 6
Figure 6
Cross-sectional microstructures of FSWed Al-Si-Mg-Fe-3.4%Zn; (a) overall view; (b) BM, (c) HAZ, (d) RS-NZ, (e) NZ, (f) AS-NZ.
Figure 7
Figure 7
Cross-sectional microstructures of FSWed Al-Si-Mg-Fe-6.5%Zn; (a) overall view; (b) BM, (c) HAZ, (d) RS-NZ, (e) NZ, (f) AS-NZ.
Figure 8
Figure 8
Cross-sectional microstructures of FSWed Al-Si-Mg-Fe-8.3%Zn; (a) overall view; (b) BM, (c) HAZ, (d) RS-NZ, (e) NZ, (f) AS-NZ.
Figure 9
Figure 9
Distribution map of α-Al {111}<110> texture of different specimens.
Figure 10
Figure 10
Phases and band contrast maps of (a) as-cast Al-Si-Mg-Fe-0%Zn, (b) as-cast Al-Si-Mg-Fe-3.4%Zn, (c) as-cast Al-Si-Mg-Fe-6.5%Zn, and (d) as-cast Al-Si-Mg-Fe-8.3%Zn.
Figure 11
Figure 11
Grain size of different regions of FSWed joints.
Figure 12
Figure 12
KAM maps of different zones of the cross-sections of FSWed joints.
Figure 13
Figure 13
Percentage of LAGBs and HAGBs of different regions of FSWed joints.
Figure 14
Figure 14
Bright-field (BF) TEM image of α-Al matrix, HRTEM image and Fast Fourier Transformation (FFT) of MgZn2 in as-cast Al-Si-Mg-Fe-8.3%Zn.
Figure 15
Figure 15
Bright-field (BF) TEM image of α-Al matrix, HRTEM image and Fast Fourier Transformation (FFT) of MgZn2 in FSWed Al-Si-Mg-Fe-8.3%Zn.
Figure 16
Figure 16
XRD patterns of (a) as-cast alloys and (b) FSWed joints with different Zn contents.
Figure 17
Figure 17
XPS narrow-scan spectra of Zn 2p for (a) as-cast alloys and (b) FSWed joints in NZ.
Figure 18
Figure 18
XPS narrow-scan spectra of Mg 1s for (a) the as-cast alloys and (b) the FSWed joints.
Figure 19
Figure 19
Hardness profiles across the cross-sections of FSWed joints.
Figure 20
Figure 20
Tensile curves of as-cast alloys and FSWed joints.
Figure 21
Figure 21
Fracture surface of various specimens after tensile test.
Figure 22
Figure 22
(a) OCP vs. time, (b) polarization curves, (c) Nyquist plots and (d) Bode plots of as-cast alloys.
Figure 23
Figure 23
(a) OCP vs. time, (b) polarization curves, (c) Nyquist plots and (d) Bode plots of NZs of FSWed joints.
Figure 24
Figure 24
SE and BSE images of the corroded surface of as-cast alloys after polarization test.
Figure 25
Figure 25
SE and BSE images of the corroded surface of NZs of FSWed joints after polarization test.
Figure 26
Figure 26
High magnification BSE image, the elements of some points and the EDS mapping of surface corrosion morphology of as-cast Al-Si-Mg-Fe-6.5%Zn.
Figure 27
Figure 27
High magnification BSE image, the elements of some points and the EDS mapping of surface corrosion morphology of FSWed joint of Al-Si-Mg-Fe-6.5%Zn.

References

    1. Ersoy E., Schaffer M.E., Ditzen J. BP Statistical Review of World Energy. 68th ed. British Petroleum Company; London, UK: 2019. pp. 2–60.
    1. Luo A., Sachdev A., Powell B. Advanced casting technologies for lightweight automotive application. Casting. 2011;60:113–119.
    1. Hirsch J. Recent development in aluminium for automotive applications. Trans. Nonferrous Met. Soc. China. 2014;24:1995–2002. doi: 10.1016/S1003-6326(14)63305-7. - DOI
    1. Zhang D.D., Liu Y.B., Zhang R.H. Research on Die Casting Process of AlSi9Cu Aluminum Alloy for Automobile. Hot Work. Technol. 2023;52:75–78. doi: 10.14158/j.cnki.1001-3814.20212925. - DOI
    1. Li Y.Y., Zhang W.W., Zhao H., You D.D., Zhang D.T., Shao M., Zhang W. Research progress on squeeze casting in China. China Foundry. 2014;11:239–246.

LinkOut - more resources