. 2025 Jun 27;13(7):1507.
doi: 10.3390/microorganisms13071507.

Probiotic Supplementation Improves Gut Microbiota in Chronic Metabolic and Cardio-Cerebrovascular Diseases Among Chinese Adults over 60: Study Using Cross-Sectional and Longitudinal Cohorts

Affiliations

Probiotic Supplementation Improves Gut Microbiota in Chronic Metabolic and Cardio-Cerebrovascular Diseases Among Chinese Adults over 60: Study Using Cross-Sectional and Longitudinal Cohorts

Xi Wang et al. Microorganisms. .

Abstract

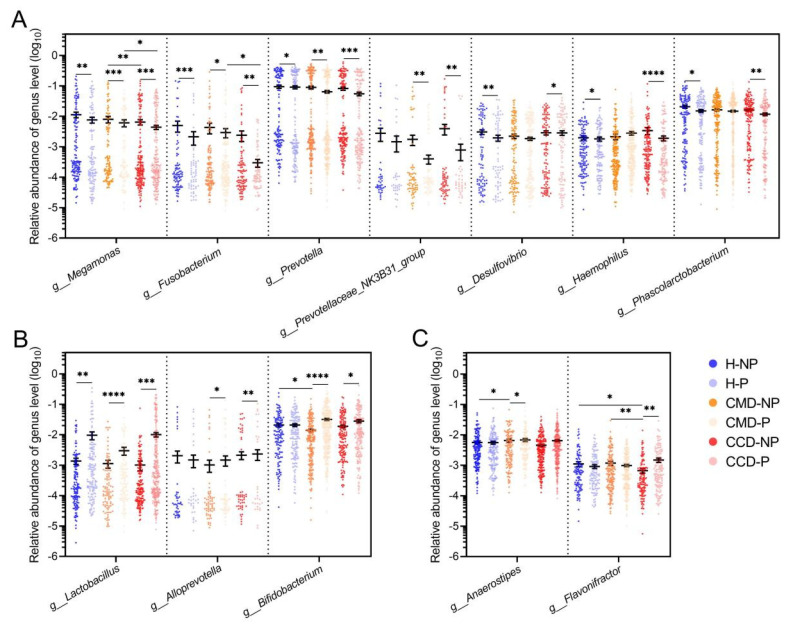
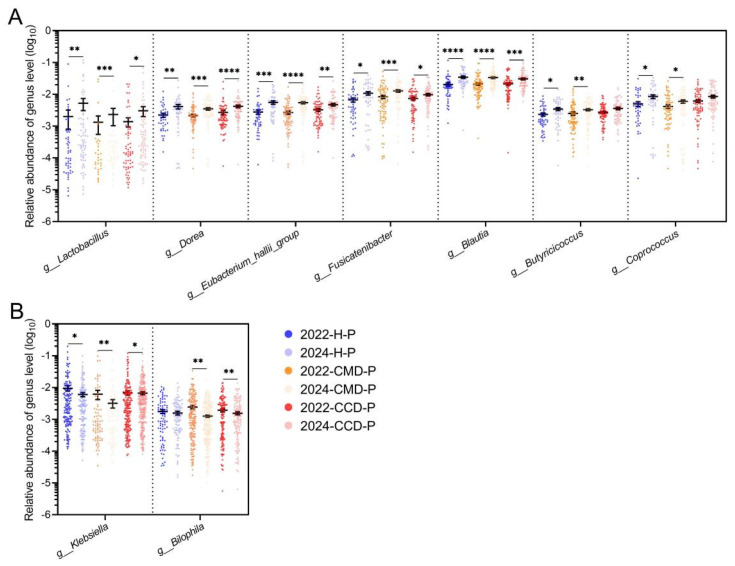
Probiotics demonstrate the ability to maintain intestinal homeostasis and promote gut health. However, their effects on gut microbiota in adults over 60 years old with chronic metabolic disease (CMD) or cardio-cerebrovascular disease (CCD) remain poorly understood. This study analyzed 1586 stool samples from 1377 adults (CMD, CCD, and healthy controls) using 16S rRNA sequencing. Cohort 1 (n = 1168) was used for cross-sectional analysis, while cohort 2 (n = 209) underwent longitudinal assessment over approximately 13 months. The results demonstrated that probiotics promoted significant gut microbiota alterations across both cohorts. Probiotic supplementation significantly increased lactobacilli in the CMD, CCD, and H groups. In both cohorts, probiotic supplementation enhanced Butyricicoccus, Clostridium sensu stricto 1, and Coprococcus in H groups, enhanced Anaerostipes and Fusicatenibacter in CMD groups, and reduced Haemophilus and Lachnospira in CCD groups. Notably, long-term supplementation not only elevated Dorea, Eubacterium hallii group, and Blautia in all groups but also suppressed Klebsiella and Bilophila in the CMD and CCD groups. Enterotype analysis revealed that probiotics increased the proportion of enterotype 1 and transition probabilities from enterotype 2 to 1 in the CMD and CCD groups, demonstrating that CCD/CMD gut microbiota exhibited greater responsiveness to probiotic modulation. Overall, this study suggests probiotics' role in modulating adult gut microbiota and their potential benefits in chronic metabolic and cardio-cerebrovascular diseases.

Keywords: 16S rRNA gene sequencing; cross-sectional cohort; gut microbiota; longitudinal cohort; probiotic supplementation.


Conflict of interest statement

Author Yan Liu was employed by the company Yingdong Intelligent Technology (Shandong) Co., Ltd. The remaining authors declare that the research was conducted in the absence of any commercial or financial relationships that could be construed as a potential conflict of interest.

Figures

Figure 1
Figure 1
Differences in gut microbiota between the CMD and CCD groups and the healthy group in cohort 1, both without probiotic supplementation. (A) α-diversity assessed via Chao1 and Shannon indices at ASV level. (B) β-diversity evaluation of microbial communities at ASV level. Principal coordinate analysis (PCoA) visualization employing Bray–Curtis distance. Statistical evaluation of intergroup differences was implemented through adonis tests (999 iterations), with R2 values quantifying explained variance and p-values denoting significance displayed in panels. (C) Global composition of gut microbiota at the genus level within NP groups. Only the top 10 taxa are presented in the graph. (D) LEfSe comparisons between the CMD and CCD groups and the healthy group. Only taxonomic features with LDA scores exceeding 2.0 (log10 scale) were considered. This analytical approach was restricted to bacterial genera exhibiting relative abundances above 0.1%. Statistical significance was determined using Mann–Whitney U test, *, p < 0.05, **, p < 0.01.
Figure 2
Figure 2
The effect of probiotic supplementation on the gut microbiota of three health status categories in cohort 1. (A) α-diversity assessed through Chao1 and Shannon indices at ASV level. (B) Comparative analysis of Bray–Curtis dissimilarity measures between the CMD and CCD groups and the healthy group, categorized according to probiotic supplementation status. (C) β-diversity evaluation of microbial communities at ASV level. PCoA visualization employing Bray–Curtis distance. Statistical evaluation of intergroup differences was implemented through adonis tests (999 iterations), with R2 values quantifying explained variance and p-values denoting significance displayed in panels. (D) LEfSe comparisons between P and NP groups within each health status category (CMD, CCD, and healthy groups). Only taxonomic features demonstrating LDA scores exceeding 2.0 (log10 scale) were considered. This analytical approach was restricted to bacterial genera exhibiting relative abundances above 0.1%. Statistical significance was determined using Mann–Whitney U test; *, p < 0.05; ***, p < 0.001; ****, p < 0.0001.
Figure 3
Figure 3
Changes in gut bacteria across groups in cohort 1 resulting from probiotic supplementation. (A) Gut bacteria inhibited by probiotic supplementation. Only bacteria with significantly decreased relative abundance in at least two P groups (including CCD-P, CMD-P, and H-P) compared to their corresponding NP groups (including CCD-NP, CMD-NP, and H-NP) are shown. (B) Gut bacteria promoted by probiotic supplementation. Only bacteria with significantly increased relative abundance in at least two P groups (including CCD-P, CMD-P, and H-P) compared to their corresponding NP groups (including CCD-NP, CMD-NP, and H-NP) are shown. (C) Gut microbes that exhibit the same trend of change in both the healthy group without probiotic supplementation (H-NP) and the CMD and CCD groups with probiotic supplementation (CMD-P and CCD-P), relative to the CMD and CCD groups without probiotic supplementation (CMD-NP and CCD-NP). Statistical significance was determined using Mann–Whitney U test; *, p < 0.05; **, p < 0.01; ***, p < 0.001; ****, p < 0.0001.
Figure 4
Figure 4
The effect of long-term probiotic supplementation on the gut microbiota of three health status categories in cohort 2. (A) α-diversity assessed through Chao1 and Shannon indices at ASV resolution. (B) β-diversity evaluation of microbial communities at ASV level. PCoA visualization employing Bray–Curtis distance. Statistical evaluation of intergroup differences was implemented through adonis tests (999 iterations), with R2 values quantifying explained variance and p-values denoting significance displayed in panels. (C) LEfSe comparisons between 2022 and 2024 batches within each health status category (CMD, CCD, and healthy groups). Taxonomic features demonstrating LDA scores exceeding 2.0 (log10 scale) were considered. This analytical approach was restricted to bacterial genera exhibiting relative abundances above 0.1%.
Figure 5
Figure 5
Changes in gut bacteria across groups in cohort 2 resulting from long-term probiotic supplementation. (A) Gut bacteria promoted by long-term probiotic supplementation. Only bacteria with significantly increased relative abundance in at least two of the health status groups within the 2024 batch (including 2024-CCD-P, 2024-CMD-P, and 2024-H-P) compared to their counterpart groups in the 2022 batch (including 2022-CCD-P, 2022-CMD-P, and 2022-H-P) are presented. (B) Gut bacteria inhibited by long-term probiotic supplementation. Only bacteria with significantly decreased relative abundance in at least two of the health status groups within the 2024 batch (including 2024-CCD-P, 2024-CMD-P, and 2024-H-P) compared to their counterpart groups in the 2022 batch (including 2022-CCD-P, 2022-CMD-P, and 2022-H-P) are presented. Mann–Whitney U test was used for statistical analysis; *, p < 0.05; **, p < 0.01; ***, p < 0.001; ****, p < 0.0001.
Figure 6
Figure 6
Effect of probiotic supplementation on enterotypes in individuals with different health status. (A) Enterotype analysis of cohort 1. (B) Distribution of enterotype proportions across groups in cohort 1. (C) Changes in E1 proportions between the P groups and their corresponding NP groups in cohort 1. (D) Enterotype analysis of cohort 2. (E) Distribution of enterotype proportions across groups in cohort 2. (F) Markov chain analysis of transition probabilities between the two enterotypes in cohort 2. Arrow weights represent the maximum likelihood estimates of the transition probabilities between different states. Only probabilities greater than 0.2 are displayed. E1, enterotype 1; E2, enterotype 2. The dominant contributing bacteria for enterotype 1 are Bacteroides, and those for enterotype 2 are Prevotella.

Similar articles

References

    1. Jiang C.H., Zhu F., Qin T.T. Relationships between Chronic Diseases and Depression among Middle-aged and Elderly People in China: A Prospective Study from CHARLS. Curr. Med. Sci. 2020;40:858–870. doi: 10.1007/s11596-020-2270-5. - DOI - PubMed
    1. Lin H., Li Q., Hu Y., Zhu C., Ma H., Gao J., Wu J., Shen H., Jiang W., Zhao N., et al. The prevalence of multiple non-communicable diseases among middle-aged and elderly people: The Shanghai Changfeng Study. Eur. J. Epidemiol. 2017;32:159–163. doi: 10.1007/s10654-016-0219-6. - DOI - PubMed
    1. Yang G., Wei J., Liu P., Zhang Q., Tian Y., Hou G., Meng L., Xin Y., Jiang X. Role of the gut microbiota in type 2 diabetes and related diseases. Metabolism. 2021;117:154712. doi: 10.1016/j.metabol.2021.154712. - DOI - PubMed
    1. Jastroch M., Ussar S., Keipert S. Gut microbes controlling blood sugar: No fire required. Cell Metab. 2020;31:443–444. doi: 10.1016/j.cmet.2020.02.007. - DOI - PubMed
    1. Li J., Zhao F., Wang Y., Chen J., Tao J., Tian G., Wu S., Liu W., Cui Q., Geng B., et al. Gut microbiota dysbiosis contributes to the development of hypertension. Microbiome. 2017;5:14. doi: 10.1186/s40168-016-0222-x. - DOI - PMC - PubMed

LinkOut - more resources