. 2025 Jun 28;13(7):1516.
doi: 10.3390/microorganisms13071516.

Integrated Transcriptomic and Proteomic Analyses Reveal CsrA-Mediated Regulation of Virulence and Metabolism in Vibrio alginolyticus

Affiliations

Integrated Transcriptomic and Proteomic Analyses Reveal CsrA-Mediated Regulation of Virulence and Metabolism in Vibrio alginolyticus

Bing Liu et al. Microorganisms. .

Abstract

Vibrio alginolyticus, a common Gram-negative opportunistic pathogen of marine animals and humans, is known for its rapid growth in organic-matter-rich environments. However, it remains unclear how it incorporates metabolic pathways in response to diverse carbon and nitrogen sources and rapidly alters gene expression. Increasing evidence suggests that post-transcriptional regulation by RNA-binding proteins and small RNAs (sRNAs) plays a crucial role in bacterial adaptation and metabolism. CsrA (carbon storage regulator A), a conserved post-transcriptional regulator in Gammaproteobacteria, is poorly characterized in Vibrio species. Using integrated transcriptomic and proteomic analyses, we found that CsrA alters the expression of 661 transcripts and 765 protein transcripts in V. alginolyticus, influencing key pathways including central carbon metabolism, amino acid metabolism and transport, quorum sensing, and bacterial secretion systems. Through directed CsrA-RNA EMSAs, we identified several direct mRNA targets of CsrA, including gltB, gcvP, aceE, and tdh, as well as secretion system components (tagH, tssL, yopD, and sctC). Notably, CsrA also directly regulates rraA, a key modulator of ribonuclease activity, suggesting a broader role in RNA metabolism. Our findings establish CsrA as a global regulator in V. alginolyticus, expanding the known targets of CsrA and providing new insights into its regulatory roles.

Keywords: CsrA; Vibrio alginolyticus; amino acid metabolism; central carbon metabolism; transcription factor; virulence.


Conflict of interest statement

The authors declare no conflicts of interest.

Figures

Figure 1
Figure 1
Overview of RNA transcriptomic and proteomic profiles of wildtype and csrA mutant strains. (A) Volcanic map of differential genes in transcriptome (FDR < 0.05, |log2 (fold change)| ≥ 1) (left panel) and statistical column chart of differentially expressed genes (right panel). WT: wildtype strain V. alginolyticus ZJ-T; R6H: csrA mutant strain ZJ-T-csrAR6H. Red dot represents significantly upregulated difference; green dot represents significantly downregulated difference; black dot represents no difference. (B) Volcanic map of differential proteins in proteomics (FDR < 0.05, |fold change| ≥ 1.5) (left panel) and statistical column chart of differentially expressed proteins (right panel). Red dot represents significantly upregulated difference; blue dot represents significantly downregulated difference; gray dot represents no difference. WT: wildtype strain V. alginolyticus ZJ-T; R6H: csrA mutant strain ZJ-T-csrAR6H. (C) Histogram of top 21 KEGG pathway enrichments in transcriptomics after mutation of csrA. (D) Histogram of top 26 KEGG pathway enrichments in proteomics after mutation of csrA.
Figure 2
Figure 2
Integrated analyses of proteomics and transcriptomics. (A) Four-quadrant map analysis of proteomics and transcriptomics data. NDEPs, Non-Differentially Expressed Proteins; NDEGs, Non-Differentially Expressed Genes; DEGs, Differentially Expressed Genes; DEPs, Differentially Expressed Proteins. (B) Venn diagram of differentially expressed genes (DEGs) and differentially expressed proteins (DEPs) in wildtype and csrA mutant strains. (C) Pathway enrichment and correlation in wildtype and csrA mutant strains.
Figure 3
Figure 3
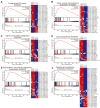
Gene Set Enrichment Analysis (GSEA) and gene expression heatmap of key pathways in TCA cycle and amino acid metabolism. (A) (left panel) GSEA of TCA cycle pathway in csrA mutant compared to wildtype. Normalized enrichment score (NES) and false discovery rate (FDR) are indicated. Significant enrichment (FDR = 0.05) suggests altered TCA cycle activity in csrA mutant. (right panel) Heatmap of gene expression levels for key genes involved in TCA cycle. (B) GSEA of valine, leucine, and isoleucine degradation pathway in csrA mutant compared to wildtype (FDR < 0.05) and heatmap of gene expression levels for key genes involved in this pathway. (C) GSEA of arginine and proline metabolism pathway in csrA mutant compared to wildtype (FDR = 0.05) and heatmap of gene expression levels for key genes involved in this pathway. (D) GSEA of lysine biosynthesis pathway in csrA mutant compared to wildtype (FDR = 0.05) and heatmap of gene expression levels for key genes involved in this pathway. (E) GSEA of phenylalanine, tryosine, and tryptophan biosynthesis pathway in csrA mutant compared to wildtype (FDR, = 0.05) and heatmap of gene expression levels for key genes involved in this pathway. (F) GSEA of cysteine and methionine metabolism pathway in csrA mutant compared to wildtype (FDR = 0.05) and heatmap of gene expression levels for key genes involved in this pathway. Rows represent genes, and columns represent samples. Expression levels are normalized and color-coded (red: upregulation; blue: downregulation). Data are derived from RNA-seq analysis (n = 3).
Figure 4
Figure 4
CsrA regulates the tricarboxylic acid cycle and amino acid metabolism. The frame filled with yellow represents different pathways of amino acids. The red arrow represents differential expression only in the proteome, the purple arrow represents differential expression in both the transcriptome and proteome, and the blue arrows represent differential expression only in the transcriptome. The black arrows indicate no difference.
Figure 5
Figure 5
CsrA modulates genes involved in ABC transporters, the bacterial secretion system, the outer membrane, and transcription factors. (A) The expression of genes of amino acid transporters, peptide transporters, and siderophore-related genes by qPCR in wildtype and csrA mutant strains. Blue represents genes of amino acid transport (proX, aotP, braF, putP, argT, artI, artP, artI, ousX, and ousV), purple represents genes of oligopeptide transport (oppF, oppD, oppA, oppC, dppC, gsiA, yejF, dppB, oppF, and mppA), and green represents genes of iron transport (fiu, hgbA, fecA, feoA, and viuB). (B) (left panel) The GSEA of the ABC transporter pathway in the csrA mutant compared to the wildtype. The normalized enrichment score (NES) and false discovery rate (FDR) are indicated. Significant enrichment (FDR = 0.05) suggests an altered ABC transporter pathway in the csrA mutant. (right panel) A heatmap of the gene expression levels for selected key genes involved in the ABC transporter. Rows represent genes, and columns represent samples. Expression levels are normalized and color-coded (red: upregulation; blue: downregulation). Data are derived from RNA-seq analysis (n = 3). (C) The expression of genes involved in bacterial secretion systems in wildtype and csrA mutant strains by qPCR. Orange represents genes involved in T6SS (tagH, tssC1, tssC2, tssB1, tssA, tssL, tssM1, and hcp). Blue represents genes involved in T3SS (cesT, BAU10_07795, yopD, sctC, and hopJ). (D) The expression of genes involved in outer membrane proteins (ompV, ompN1, ompW, ompA2, oprF, ompA3, ompA, ompP1, ompT, and ompN2) in the wildtype and csrA mutant strains by qPCR. (E) The expression of genes involved in outer transcription (nhaR, hlyU, crl, yeaG, lrp, csgD, rpoS, dctD, dmlR, rsd, rpoE, rbcR, and cspD) in the wildtype and csrA mutant strains by qPCR. The relative expression of the ZJ-T-csrAR6H strain is divided by that of the WT. The data are presented as the mean ± SD. Statistical significance was determined using Student’s t-test, p value: ns, p > 0.05; *, p < 0.05; **, p < 0.01; ***, p < 0.001; ****, p < 0.0001.
Figure 6
Figure 6
CsrA represses the translation of RraA by direct binding. (A) A schematic representation of the 5′ untranslated region (5′UTR) of rraA. The transcription start site (+1) and the translation start codon (AUG) are indicated. The 5′UTR contains three GGA motifs, which are putative CsrA binding sites; two of these motifs are located adjacent to the ribosome binding site (RBS). All thymine (T) bases have been replaced with uracil (U) to accurately represent the RNA sequence. (B) The relative expression of rraA in the wildtype ZJ-T, csrA mutant, and csrA overexpression strains. (Student’s t-test, p values: *, <0.05; **, <0.01). rraA levels were normalized to the level of the housekeeping gene recA. Error bars indicate standard deviations. (C) EMSA showing the 6xHis-CsrA-rraA RNA interaction. The RNA probe sequence is −64 to +36 for a total of 100 bp.
Figure 7
Figure 7
The RNA EMSA identified RNA targets that interact with CsrA. (A) An EMSA showing the 6xHis-CsrA-aceE RNA interaction (−100 to +100 nt relative to the start codon). The amount of aceE RNA is shown. (B) An EMSA showing the 6xHis-CsrA-acnB RNA interaction (−100 to +100 nt relative to the start codon). The amount of acnB RNA is shown. (C) An EMSA showing the 6xHis-CsrA-gltB RNA interaction (−100 to +100 nt relative to the start codon). The amount of gltB RNA is shown. (D) An EMSA showing the 6xHis-CsrA-gcvP RNA interaction (−100 to +100 nt relative to the start codon). The amount of gcvP RNA is shown. (E) An EMSA showing the 6xHis-CsrA-tdh RNA interaction (−100 to +100 nt relative to the start codon). The amount of tdh RNA is shown. (F) An EMSA showing no interaction between 6xHis-CsrA and thrA RNA (−100 to +100 nt relative to the start codon). The amount of thrA RNA is shown. (G) An EMSA showing the 6xHis-CsrA-tssL RNA interaction (−100 to +100 nt relative to the start codon). The amount of tssL RNA is shown. (H) An EMSA showing the 6xHis-CsrA-tagH RNA interaction (−100 to +100 nt relative to the start codon). The amount of tagH RNA is shown. (I) An EMSA showing the 6xHis-CsrA-cesT RNA interaction (−100 to +100 nt relative to the start codon). The amount of cesT RNA is shown. (J) An EMSA showing the 6xHis-CsrA-BAU10_07795 RNA interaction (−100 to +100 nt relative to the start codon). The amount of BAU10_07795 RNA is shown. (K) An EMSA showing the 6xHis-CsrA-yopD RNA interaction (−100 to +100 nt relative to the start codon). The amount of yopD RNA is shown. (L) An EMSA showing the 6xHis-CsrA-sctC RNA interaction (−100 to +100 nt relative to the start codon). The amount of sctC RNA is shown. (M) An EMSA showing the 6xHis-CsrA-cspD RNA interaction (−100 to +100 nt relative to the start codon). The amount of cspD RNA is shown.

Similar articles

References

    1. Weinstock M.T., Hesek E.D., Wilson C.M., Gibson D.G. Vibrio natriegens as a fast-growing host for molecular biology. Nat. Methods. 2016;13:849–851. doi: 10.1038/nmeth.3970. - DOI - PubMed
    1. Ulitzur S. Vibrio parahaemolyticus and Vibrio alginolyticus: Short generation-time marine bacteria. Microb. Ecol. 1974;1:127–135. doi: 10.1007/BF02512384. - DOI - PubMed
    1. Gripenland J., Netterling S., Loh E., Tiensuu T., Toledo-Arana A., Johansson J. RNAs: Regulators of bacterial virulence. Nat. Rev. Microbiol. 2010;8:857–866. doi: 10.1038/nrmicro2457. - DOI - PubMed
    1. Liu J.M., Camilli A. A broadening world of bacterial small RNAs. Curr. Opin. Microbiol. 2010;13:18–23. doi: 10.1016/j.mib.2009.11.004. - DOI - PMC - PubMed
    1. Pourciau C., Lai Y.-J., Gorelik M., Babitzke P., Romeo T. Diverse Mechanisms and Circuitry for Global Regulation by the RNA-Binding Protein CsrA. Front. Microbiol. 2020;11:601352. doi: 10.3389/fmicb.2020.601352. - DOI - PMC - PubMed

LinkOut - more resources