. 2025 Jun 30;13(7):1545.
doi: 10.3390/microorganisms13071545.

Gut Microbiome Modulation and Health Benefits of a Novel Fucoidan Extract from Saccharina latissima: A Double-Blind, Placebo-Controlled Trial

Affiliations

Gut Microbiome Modulation and Health Benefits of a Novel Fucoidan Extract from Saccharina latissima: A Double-Blind, Placebo-Controlled Trial

Gissel Garcia et al. Microorganisms. .

Abstract

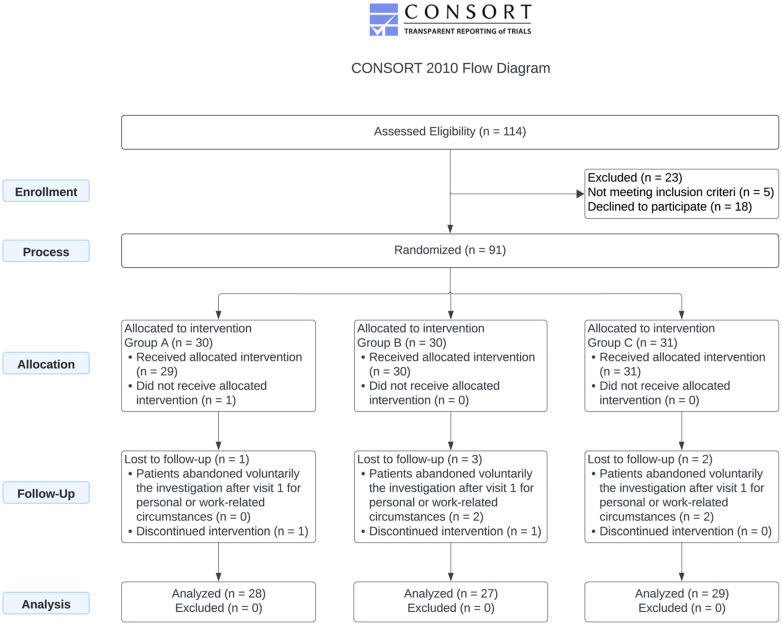
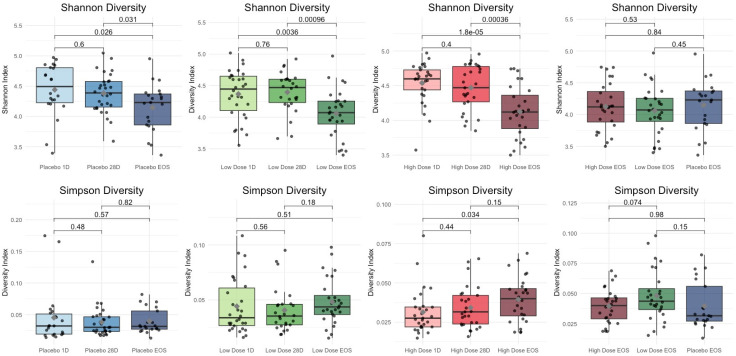
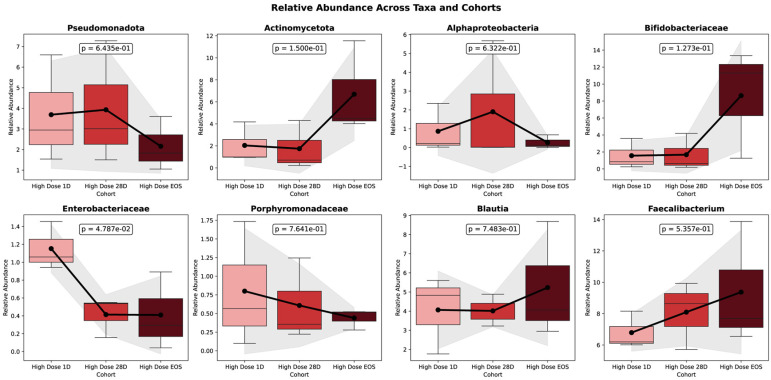
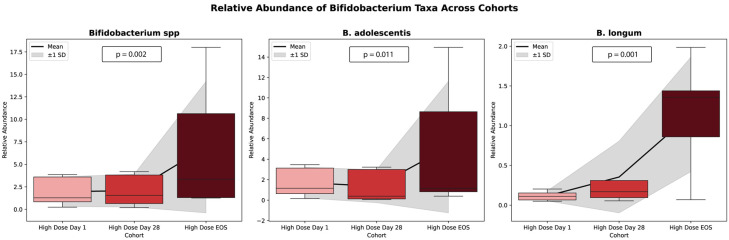
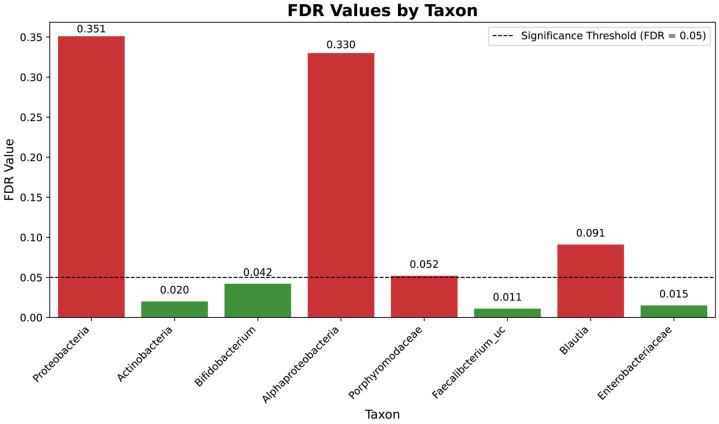
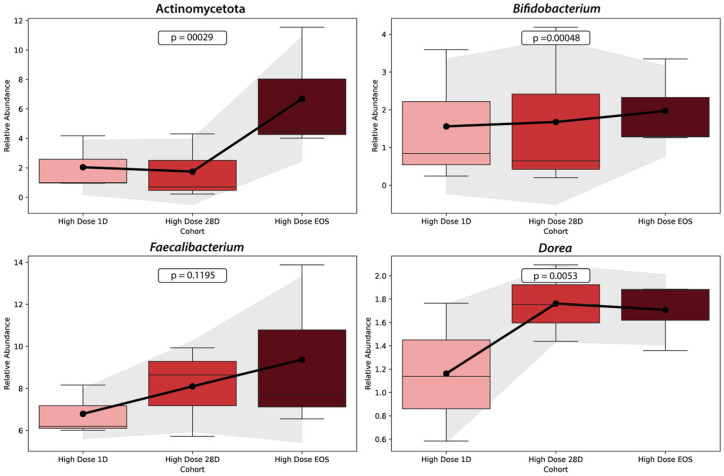
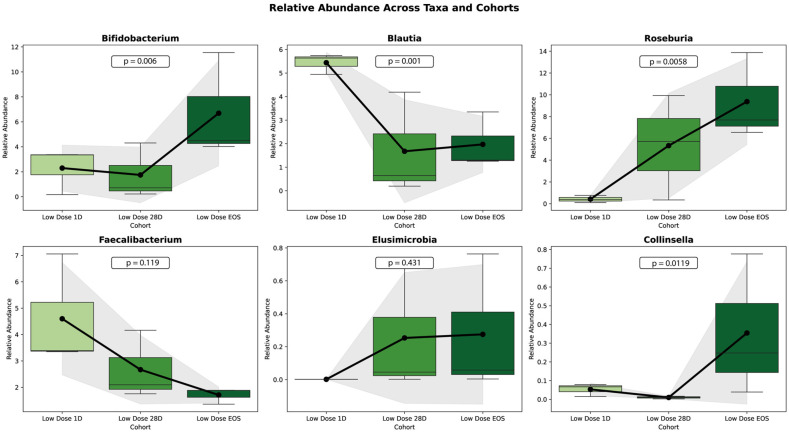
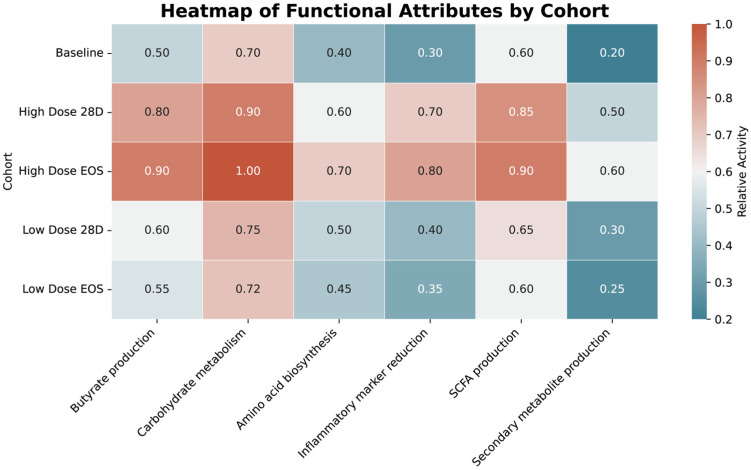
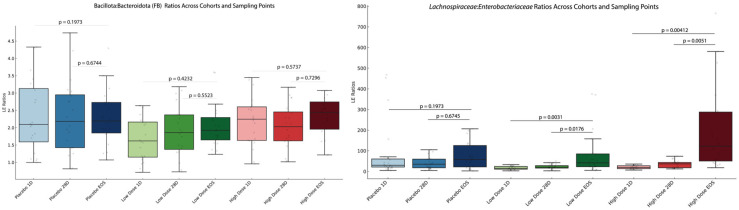
This randomized, double-blind, placebo-controlled, three-arm clinical trial evaluated the effects of a proprietary bioactive fucoidan-rich extract derived from Saccharina latissima (SLE-F) on gut microbial composition and function in healthy adults. The objective of the study was to assess the potential of SLE-F to beneficially modulate the gut microbiome, with this paper specifically reporting on microbial diversity, taxonomic shifts, and functional pathway outcomes. Ninety-one participants received either a low dose (125 mg), high dose (500 mg), or placebo twice daily for four weeks. The primary endpoint was the microbiome composition assessed via 16S rRNA sequencing (V3-V4 region), with secondary outcomes including surveys, adverse event monitoring, and clinical evaluations. High-dose supplementation resulted in dose-dependent improvements in the microbial diversity; increased abundance of beneficial taxa, including Bifidobacterium, Faecalibacterium, and Lachnospiraceae; and reductions in inflammation-associated taxa, such as Enterobacteriaceae and Pseudomonadota. A functional pathway analysis showed enhancement in short-chain fatty acid biosynthesis and carbohydrate metabolism. The low-dose group showed modest benefits, primarily increasing Bifidobacterium, with limited functional changes. In vitro colonic simulations further demonstrated a dose-dependent increase in short-chain fatty acids and postbiotic metabolite production following SLE-F exposure. SLE-F was well tolerated, with only mild, nonspecific adverse events reported. These findings support the potential of SLE-F as a safe and effective microbiome-modulating agent, warranting further study of the long-term use and synergy with dietary interventions.

Keywords: SCFA; Saccharina latissima; clinical trial; fucoidan; intestinal transit; microbiome.


Conflict of interest statement

Author Charles Bavington, Raminta Kazlauskaite, and Neil Waslidge are employed by the company Oceanium, Ltd. The authors declare that this study received funding from Oceanium, Ltd. The funder was not involved in the study design, collection, analysis, interpretation of data; the writing of this article; or the decision to submit it for publication. All other authors claim no conflict of interest.

Figures

Figure 1
Figure 1
Consort flow diagram. The study involved the administration of 125 mg (LD), 500 mg of SLE-F (HD), or a 125 mg placebo capsule (P) every 12 h for 90 days.
Figure 2
Figure 2
Discriminant analysis to identify patterns between groups. Function 1 includes the following: glucose, MCHC, MCH, HbA1c, calprotectin, neutrophils, MCV, HTC, RDW-SD, hemoglobin, eosinophils, triglycerides, and RBC. Function 2 includes the following: uric acid, intestinal transit time, monocytes, ALAT, WBC, cholesterol, ASAT, creatinine, lymphocytes, C-reactive protein, platelets, MPV, urea, and RDW-CV.
Figure 3
Figure 3
Shannon and Simpson diversity across cohorts.
Figure 4
Figure 4
Relative abundance of key taxa across time points in HD cohort.
Figure 5
Figure 5
Trends in Bifidobacterium spp. relative abundance across study phases for the high dose cohort. This chart illustrates the relative abundance of Bifidobacterium spp. across three time points: baseline (1), Day 28 (28), and end of study (EOS). Each line represents a unique participant, with the average trend across all participants denoted by the bolded mean line. The graph highlights the variability in Bifidobacterium abundance responses among participants and overall increases in abundance over time.
Figure 6
Figure 6
False Discovery Rate (FDR) analysis of taxonomic shifts across study phases for the high-dose cohort. The figure displays the FDR-adjusted p-values for the taxa analyzed, summarizing the significance of changes in microbial abundance across the baseline, Day 28, and the end of study (EOS). False Discovery Rate (FDR) analysis of taxonomic shifts across study phases for the high-dose cohort. The figure displays the FDR-adjusted p-values for the taxa analyzed, summarizing the significance of changes in microbial abundance across the baseline, Day 28, and the end of study (EOS). Taxa with FDR values below 0.05 (green bars) are highlighted as significantly enriched or depleted, while those with higher FDR values (red bars), such as Pseudomonadota, are considered non-significant. This visualization emphasizes the intervention’s differential impact on microbial taxa.
Figure 7
Figure 7
Changes in the relative abundance of key microbial taxa across study phases in the HD Cohort. This figure shows the relative abundance changes in four microbial taxa (Actinomycetota, Bifidobacterium, Faecalibacterium, and Dorea) over three time points: baseline (Day 1), Day 28, and end of study (EOS) in the HD cohort. Each panel presents the trends for a specific taxon, with boxplots displaying the data distribution and lines connecting mean values to illustrate the overall trajectory. The graph was generated using data on microbial relative abundances from the HD cohort at three time points. Statistical analyses, including p-values for trends over time, were calculated to identify significant changes in each taxon’s abundance. The visualization was performed using Python’s Seaborn v0.13.2 and Matplotlib v3.10.3 libraries, with boxplots representing variability within the cohort and shaded regions around the mean lines indicating ±1 standard deviation.
Figure 8
Figure 8
Trends in the relative abundance of key microbial taxa in the LD cohort across study phases. The relative abundances of six key taxa across three cohorts (low-dose baseline ID, low-dose 28D, and low-dose EOS) are shown as boxplots. Each boxplot displays the median (horizontal line), interquartile range (box), and outliers (dots). Overlaid are trendlines representing the mean values for each cohort (black line) and shaded areas indicating ±1 standard deviation (gray). Annotated p-values represent the statistical significance of pairwise comparisons between cohorts, calculated using a t-test.
Figure 9
Figure 9
Heatmap of functional pathway abundance across cohorts. The heatmap visualizes the relative abundance of functional pathways across cohorts, with warmer colors (red/orange) indicating higher abundance and cooler colors (blue) indicating lower abundance. The numerical values represent pathway activity levels, emphasizing significant enrichment in HD cohorts, particularly in pathways related to SCFA production, butyrate production, and carbohydrate metabolism.
Figure 10
Figure 10
L/E and F/B ratios for low- and high-dose cohorts across study phases. The figure illustrates the changes in L/E and F/B ratios across three study phases—baseline, Day 28 (28D), and end of study (EOS)—for P, LD, and HD cohorts. The left panel represents the F/B ratios for each cohort at three different sampling times. The right panel represents these results obtained for the L/E ratios. Statistical significance is indicated by the annotated p-values, highlighting changes over time within each cohort.

Similar articles

References

    1. Zhou Y., Xu Z., Zhang H., Liu T., Zhou J., Bi Y., Han Y., Tan Y., Yuan J., Yang R. When the microbiome meets One Health principle: Leading to the Holy Grail of biology and contributing to overall well-being and social sustainability. iMetaOmics. 2024;1:e30. doi: 10.1002/imo2.30. - DOI
    1. Ross F.C., Patangia D., Grimaud G., Lavelle A., Dempsey E.M., Ross R.P., Stanton C. The interplay between diet and the gut microbiome: Implications for health and disease. Nat. Rev. Microbiol. 2024;22:671–686. doi: 10.1038/s41579-024-01068-4. - DOI - PubMed
    1. Zaher A., Elsaygh J., Peterson S.J., Weisberg I.S., Parikh M.A., Frishman W.H. The Interplay of Microbiome Dysbiosis and Cardiovascular Disease. Cardiol. Rev. 2024 doi: 10.1097/CRD.0000000000000701. - DOI - PubMed
    1. Matthewman C., Narin A., Huston H., Hopkins C.E. Systems to model the personalized aspects of microbiome health and gut dysbiosis. Mol. Asp. Med. 2023;91:101115. doi: 10.1016/j.mam.2022.101115. - DOI - PubMed
    1. Noce A., Marrone G., Di Daniele F., Ottaviani E., Wilson Jones G., Bernini R., Romani A., Rovella V. Impact of Gut Microbiota Composition on Onset and Progression of Chronic Non-Communicable Diseases. Nutrients. 2019;11:1073. doi: 10.3390/nu11051073. - DOI - PMC - PubMed

Grants and funding

LinkOut - more resources