

Metagenomic and Metabolomic Perspectives on the Drought Tolerance of Broomcorn Millet (Panicum miliaceum L.)
- PMID: 40732102
- PMCID: PMC12298925
- DOI: 10.3390/microorganisms13071593
Metagenomic and Metabolomic Perspectives on the Drought Tolerance of Broomcorn Millet (Panicum miliaceum L.)
Abstract
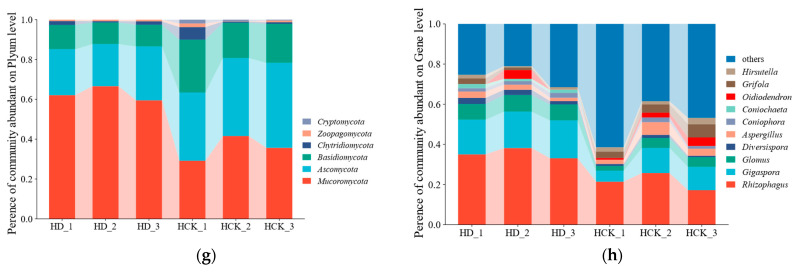
Drought stress is an important abiotic stress factor restricting crop production. Broomcorn millet (Panicum miliaceum L.) has become an ideal material for analyzing the stress adaptation mechanisms of crops due to its strong stress resistance. However, the functional characteristics of its rhizosphere microorganisms in response to drought remain unclear. In this study, metagenomics and metabolomics techniques were employed to systematically analyze the compositional characteristics of the microbial community, functional properties, and changes in metabolites in the rhizosphere soil of broomcorn millet under drought stress. On this basis, an analysis was conducted in combination with the differences in functional pathways. The results showed that the drought treatment during the flowering stage significantly altered the species composition of the rhizosphere microorganisms of broomcorn millet. Among them, the relative abundances of beneficial microorganisms such as Nitrosospira, Coniochaeta, Diversispora, Gigaspora, Glomus, and Rhizophagus increased significantly. Drought stress significantly affects the metabolic pathways of rhizosphere microorganisms. The relative abundances of genes associated with prokaryotes, glycolysis/gluconeogenesis, and other metabolic process (e.g., ribosome biosynthesis, amino sugar and nucleotide sugar metabolism, and fructose and mannose metabolism) increased significantly. Additionally, the expression levels of functional genes involved in the phosphorus cycle were markedly upregulated. Drought stress also significantly alters the content of specific rhizosphere soil metabolites (e.g., trehalose, proline). Under drought conditions, broomcorn millet may stabilize the rhizosphere microbial community by inducing its restructuring and recruiting beneficial fungal groups. These community-level changes can enhance element cycling efficiency, optimize symbiotic interactions between broomcorn millet and rhizosphere microorganisms, and ultimately improve the crop's drought adaptability. Furthermore, the soil metabolome (e.g., trehalose and proline) functions as a pivotal interfacial mediator, orchestrating the interaction network between broomcorn millet and rhizosphere microorganisms, thereby enhancing plant stress tolerance. This study sheds new light on the functional traits of rhizosphere microbiota under drought stress and their mechanistic interactions with host plants.
Keywords: broomcorn millet; drought stress; metabolomics; metagenomics; rhizosphere microorganisms.
Conflict of interest statement
The authors declare no conflicts of interest.
Figures


Similar articles
-
Drought-driven shifts in Eucommia ulmoides rhizosphere mycobiota and metabolites mediate host tolerance.Microbiol Spectr. 2025 Aug 5;13(8):e0084725. doi: 10.1128/spectrum.00847-25. Epub 2025 Jul 11. Microbiol Spectr. 2025. PMID: 40642984 Free PMC article.
-
Effects of Rehydration on Bacterial Diversity in the Rhizosphere of Broomcorn Millet (Panicum miliaceum L.) after Drought Stress at the Flowering Stage.Microorganisms. 2024 Jul 26;12(8):1534. doi: 10.3390/microorganisms12081534. Microorganisms. 2024. PMID: 39203376 Free PMC article.
-
An optimized protocol for in vitro regeneration and genetic transformation of broomcorn millet.BMC Genomics. 2025 Aug 6;26(1):725. doi: 10.1186/s12864-025-11899-x. BMC Genomics. 2025. PMID: 40770791 Free PMC article.
-
Management of urinary stones by experts in stone disease (ESD 2025).Arch Ital Urol Androl. 2025 Jun 30;97(2):14085. doi: 10.4081/aiua.2025.14085. Epub 2025 Jun 30. Arch Ital Urol Androl. 2025. PMID: 40583613 Review.
-
The Black Book of Psychotropic Dosing and Monitoring.Psychopharmacol Bull. 2024 Jul 8;54(3):8-59. Psychopharmacol Bull. 2024. PMID: 38993656 Free PMC article. Review.
References
-
- Bray E.A. Plant Responses to Water Deficit. Trends Plant Sci. 1997;2:48–54. doi: 10.1016/S1360-1385(97)82562-9. - DOI
-
- Muhammad M., Waheed A., Wahab A., Majeed M., Nazim M., Liu Y.-H., Li L., Li W.-J. Soil Salinity and Drought Tolerance: An Evaluation of Plant Growth, Productivity, Microbial Diversity, and Amelioration Strategies. Plant Stress. 2024;11:100319. doi: 10.1016/j.stress.2023.100319. - DOI
Grants and funding
LinkOut - more resources
Full Text Sources
