. 2025 Jul 17;18(7):1053.
doi: 10.3390/ph18071053.

Synthesis and Biological Evaluation of Herceptin-Conjugated Liposomes Loaded with Lipocalin-2 siRNA for the Treatment of Inflammatory Breast Cancer

Affiliations

Synthesis and Biological Evaluation of Herceptin-Conjugated Liposomes Loaded with Lipocalin-2 siRNA for the Treatment of Inflammatory Breast Cancer

Marienid Flores-Colón et al. Pharmaceuticals (Basel). .

Abstract

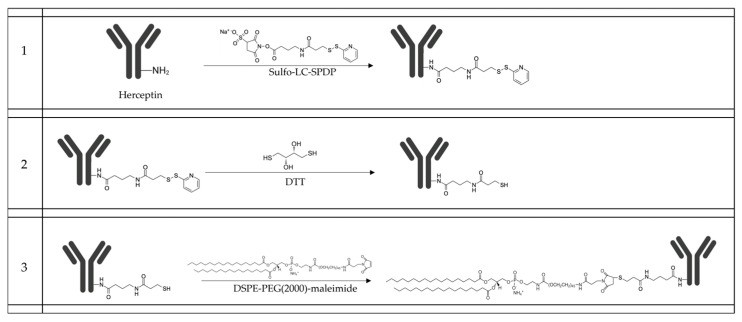
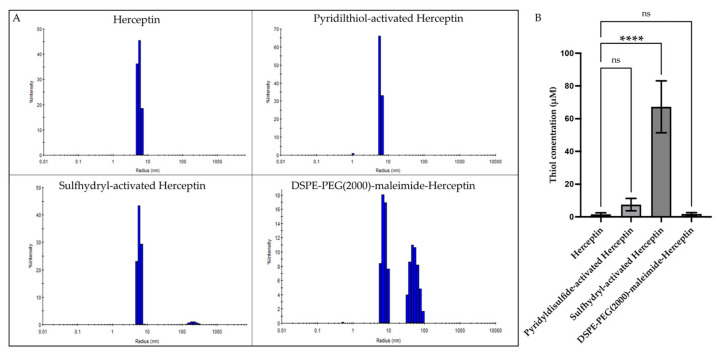
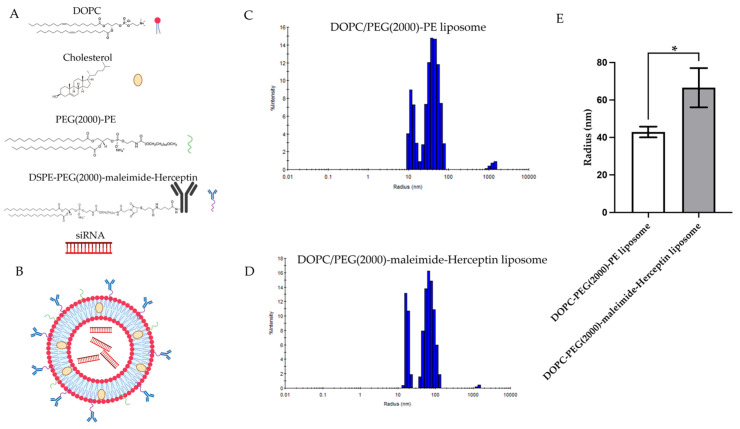
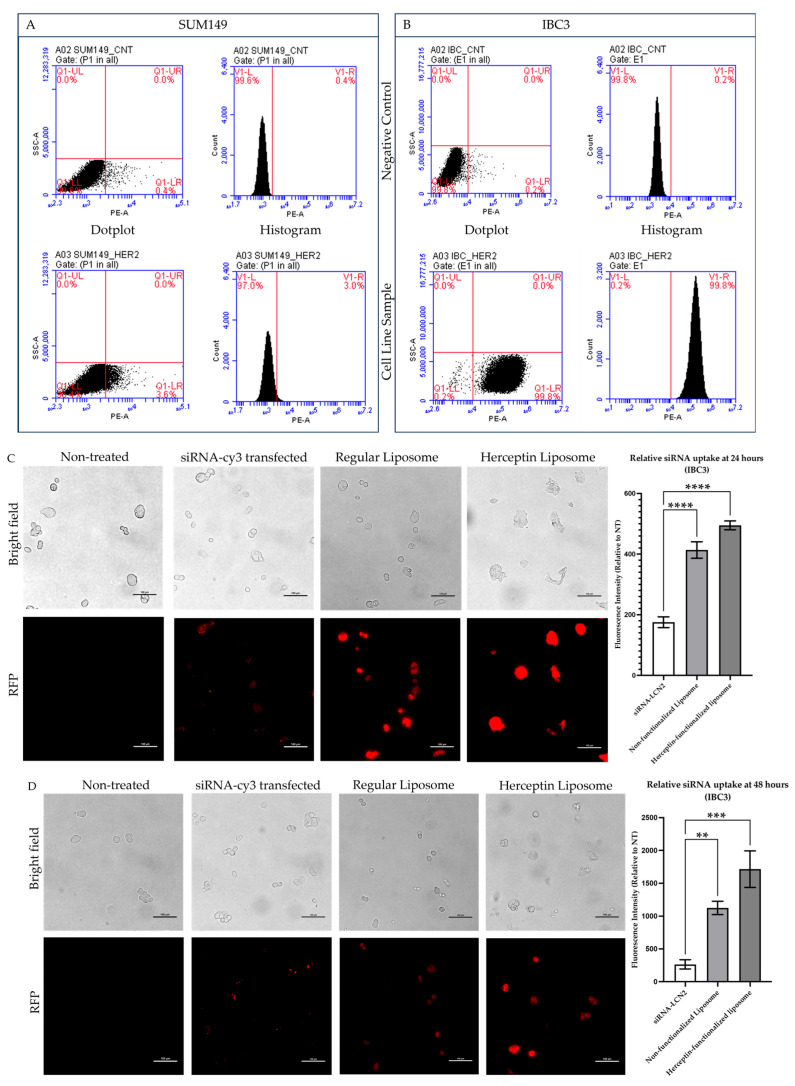
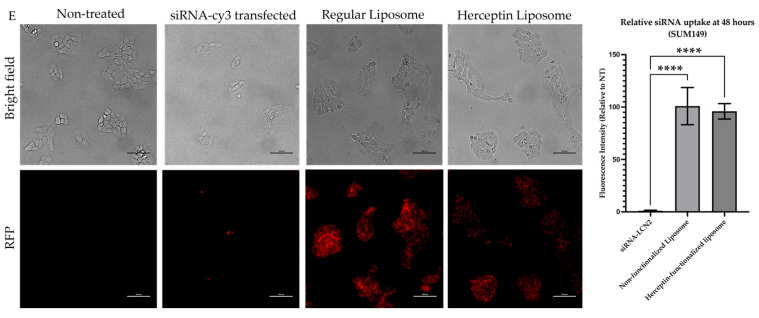
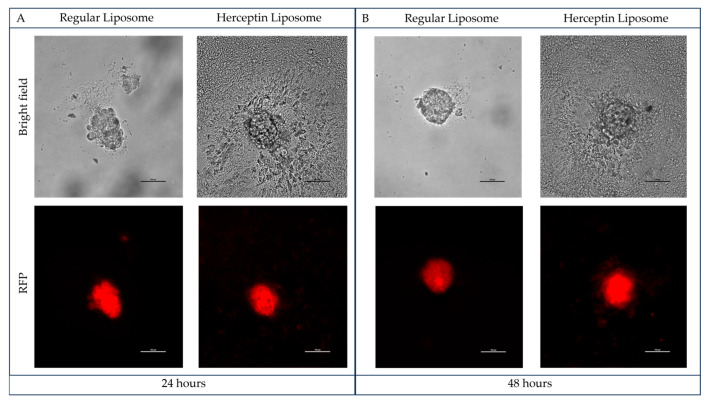
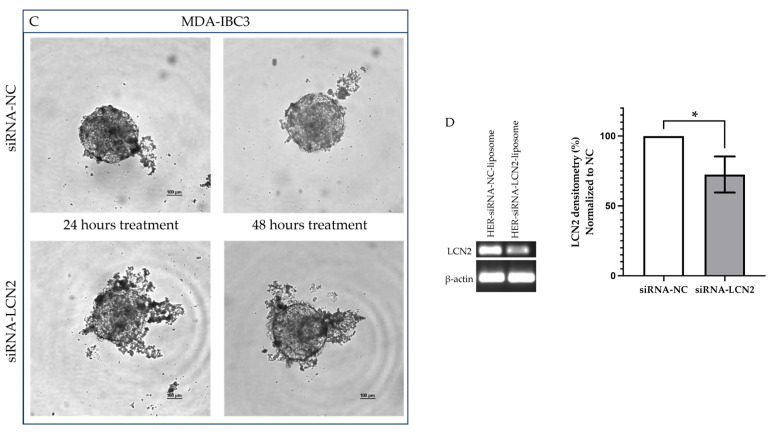
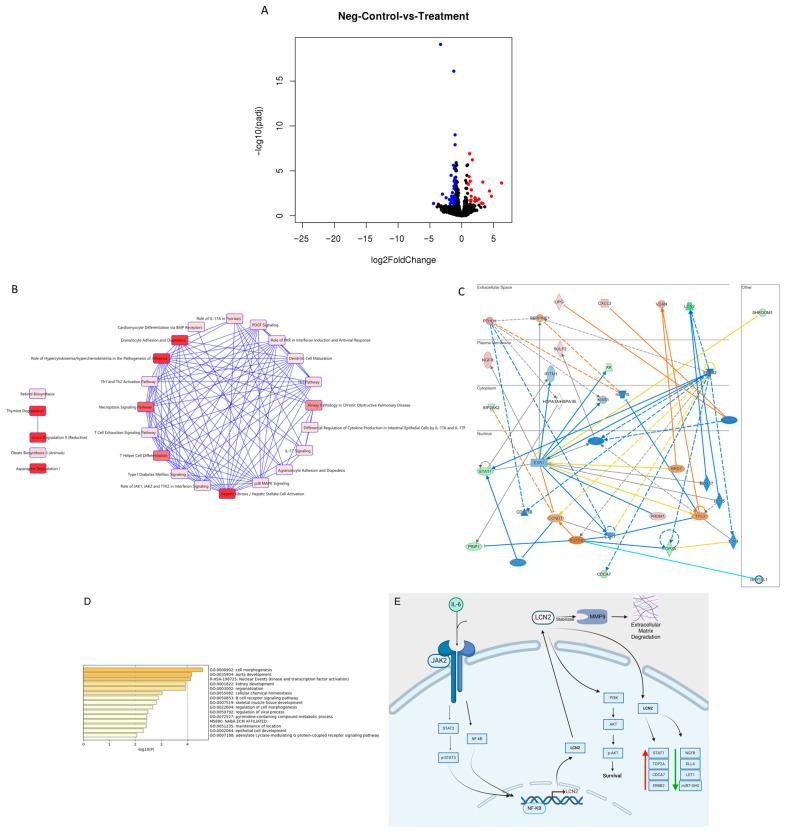
Background: Inflammatory breast cancer (IBC) is a rare and aggressive subtype of breast cancer that accounts for 1-5% of BC patients and regularly affects women under 40 years of age. Approximately 50% of IBC cases are HER2+ and can be treated with the monoclonal antibody-based therapy Herceptin (trastuzumab). However, resistance to Herceptin develops within a year, and effective second-line targeted therapies are currently unavailable for IBC patients. Lipocalin-2 (LCN2) is a promising therapeutic target for IBC due to its role in promoting tumor invasiveness, angiogenesis, and the inflammatory tumor microenvironment characteristic of IBC. Objective: We developed Herceptin-conjugated liposomes loaded with LCN2-targeted small-interference RNA (siRNA) for HER2+ IBCs. Methods: We synthesized DSPE-PEG(2000)-maleimide-Herceptin in a three-step process and formulated the liposomes together with DOPC, PEG(2000)-PE, cholesterol, and siRNA. Results: Dynamic light scattering confirmed the liposome size distribution, which was 66.7 nm for the Herceptin-conjugated liposome versus 43.0 nm in a non-functionalized liposome. Here, we report efficient internalization of this formulation into HER2+ IBC cells, reducing LCN2 levels by 30% and disrupting tumor emboli formation. RNA sequencing revealed 139 genes that were differentially expressed upon LCN2 knockdown, with 25 canonical pathways identified through Ingenuity Pathway Analysis. Conclusions: These findings suggest that LCN2-targeted siRNA within Herceptin-targeted liposomes represents a promising therapeutic strategy for IBC.

Keywords: inflammatory breast cancer; lipocalin-2; liposomes; siRNA; tumor emboli.


Conflict of interest statement

The authors declare no conflicts of interest.

Figures

Scheme 1
Scheme 1
Scheme of the three consecutive reactions for the synthesis of DSPE-PEG(2000)-maleimide conjugated to Herceptin. Step 1 produces the pyridylthiol-activated Herceptin; step 2 produces the sulfhydryl-activated Herceptin; and step 3 shows the final conjugate product of DSPE-PEG(2000) maleimide-Herceptin.
Figure 1
Figure 1
Dynamic light scattering (DLS) analysis and thiol quantification of Herceptin and Herceptin-conjugates. (A) DLS histograms show the size distributions of Herceptin (5.7 ± 0.4 nm), pyridylthiol-activated Herceptin (6.2 ± 0.1 nm), sulfhydryl-activated Herceptin (5.8 ± 0.3 nm), and DSPE-PEG(2000)-maleimide-Herceptin. The histography for DSPE-PEG(2000)-maleimide-Herceptin displays two particle populations at 8.4 ± 2.2 nm and 40.5 ± 12.1 nm, representing populations of different lamellarities. (B) Quantification of thiol concentration (μM) of Herceptin and its conjugates. The graph shows a significant increase in thiol concentration in sulfhydryl-activated Herceptin (67.2 ± 15.9 nm; **** p < 0.0001) compared to Herceptin alone (1.60 ± 0.4 nm) and pyridylthiol-activated Herceptin (7.4 ± 1.1 nm). Following the conjugation with DSPE-PEG(2000)-maleimide, the thiol concentration decreased to 1.69 ± 0.9 nm, confirming a successful conjugation. Statistical analysis was performed using one-way ANOVA (Dunnett’s test). **** p < 0.001, ns = non-significant. Data represent mean ± SD of three independent experiments (n = 3).
Figure 2
Figure 2
Chemical composition, assembly, and DLS size distribution of liposomal formulations. (A) Chemical structure of individual lipid components used in the liposome formulation, including DOPC, cholesterol, DSPE-PEG(2000)-maleimide-Herceptin conjugate, and PEG(2000)-PE. (B) Schematic representation of liposome assembly, demonstrating the binding of Herceptin-PEG conjugate via hydrophobic interactions and siRNA encapsulation. (C) Dynamic light scattering (DLS) analysis of non-functionalized liposomes showing two populations with a radius of 15.4 ± 6.8 nm and 43.0 ± 2.9 nm. (D) DLS analysis of Herceptin-functionalized liposomes showing increased sizes of 22.3 ± 5.7 nm and 66.7 ± 10.5 nm, consistent with successful conjugation. Each formulation was analyzed in three independent experiments (n = 3). Data are presented as mean ± Standard Deviation (SD). Polydispersity index (PDIs) ranged from 13% to 29%, confirming homogeneity of the liposomal preparations. (E) Statistical comparison of liposome radii showing a significant increase in size for Herceptin-functionalized liposomes compared to non-functionalized liposomes, based on unpaired two-tailed t-test (* p < 0.05).
Figure 3
Figure 3
HER2 expression and siRNA/liposome internalization in IBC3 and SUM149 cells. Flow cytometry analysis was used to quantify HER2 receptor levels in (A) IBC3 (HER2-positive) and (B) SUM149 (triple-negative) cell lines. IBC3 cells exhibited high HER2 expression, with 99.8% of the population being HER2-positive, whereas only 3% of SUM149 cells were HER2-positive, validating IBC3 as an appropriate model for HER2-targeted therapies. Internalization of fluorescently labeled siRNA-Cy3 delivered via different liposomal formulations was evaluated at (C) 24 h and (D) 48 h post-treatment in IBC3 cells, and (E) 48 h in SUM149 cells. Each panel includes bright field (BF) and red fluorescent protein (RFP) images for four treatment conditions: untreated, siRNA-Cy3 positive control (transfected), non-functionalized liposomes, and Herceptin-functionalized liposomes. Quantification of fluorescence intensity demonstrated that Herceptin-functionalized liposomes achieved greater internalization in HER2+ IBC3 cells, with the highest uptake observed at 48 h. In contrast, non-functionalized liposomes exhibited slower and reduced uptake. Internalization was significantly lower in HER2-negative SUM149 cells, further confirming the HER2-specific targeting capabilities of the Herceptin-conjugated formulation. Experiments were done in triplicate. Images were acquired at 10× magnification using a Nikon Eclipse TS2R fluorescence microscope. Bars: three microscope fields, +/− SD, ** p < 0.01, *** p < 0.001, **** p < 0.0001.
Figure 3
Figure 3
HER2 expression and siRNA/liposome internalization in IBC3 and SUM149 cells. Flow cytometry analysis was used to quantify HER2 receptor levels in (A) IBC3 (HER2-positive) and (B) SUM149 (triple-negative) cell lines. IBC3 cells exhibited high HER2 expression, with 99.8% of the population being HER2-positive, whereas only 3% of SUM149 cells were HER2-positive, validating IBC3 as an appropriate model for HER2-targeted therapies. Internalization of fluorescently labeled siRNA-Cy3 delivered via different liposomal formulations was evaluated at (C) 24 h and (D) 48 h post-treatment in IBC3 cells, and (E) 48 h in SUM149 cells. Each panel includes bright field (BF) and red fluorescent protein (RFP) images for four treatment conditions: untreated, siRNA-Cy3 positive control (transfected), non-functionalized liposomes, and Herceptin-functionalized liposomes. Quantification of fluorescence intensity demonstrated that Herceptin-functionalized liposomes achieved greater internalization in HER2+ IBC3 cells, with the highest uptake observed at 48 h. In contrast, non-functionalized liposomes exhibited slower and reduced uptake. Internalization was significantly lower in HER2-negative SUM149 cells, further confirming the HER2-specific targeting capabilities of the Herceptin-conjugated formulation. Experiments were done in triplicate. Images were acquired at 10× magnification using a Nikon Eclipse TS2R fluorescence microscope. Bars: three microscope fields, +/− SD, ** p < 0.01, *** p < 0.001, **** p < 0.0001.
Figure 4
Figure 4
Effects of liposomes on IBC tumor emboli. Internalization and effect of non-functionalized and Herceptin-conjugated liposomes after (A) 24 h and (B) 48 h post-treatment, captured using bright field (BF) and red fluorescent protein (RFP) filters at 20× magnification. (C) Effect of LCN2 knockdown on IBC3 tumor emboli at 24 and 48 h. (D) LCN2 mRNA knockdown in HER2+ IBC3 tumor emboli treated with Herceptin-conjugated liposomes loaded with siRNA-LCN2. * p < 0.05. Bars: ±SD of triplicates.
Figure 4
Figure 4
Effects of liposomes on IBC tumor emboli. Internalization and effect of non-functionalized and Herceptin-conjugated liposomes after (A) 24 h and (B) 48 h post-treatment, captured using bright field (BF) and red fluorescent protein (RFP) filters at 20× magnification. (C) Effect of LCN2 knockdown on IBC3 tumor emboli at 24 and 48 h. (D) LCN2 mRNA knockdown in HER2+ IBC3 tumor emboli treated with Herceptin-conjugated liposomes loaded with siRNA-LCN2. * p < 0.05. Bars: ±SD of triplicates.
Figure 5
Figure 5
Transcriptomic and pathway analysis of dysregulated genes following LCN2 Knockdown in HER2+ MDA-IBC3 cells. (A) Volcano plot showing the distribution of differentially expressed genes based on log2FoldChange and –log10(adjusted p-value). Blue dots represent significantly downregulated genes, red dots represent significantly upregulated genes, and black dots indicate genes with no significant change (padj ≥ 0.05). (B) IPA-based identification of the top 25 canonical pathways influenced by LCN2 knockdown. (C) IPA-generated network depicting functional interactions among differentially expressed genes. Nodes represent individual transcripts: red (upregulated), green (downregulated), orange (predicted activation), and blue (predicted inhibition). Solid and dashed lines denote direct and indirect interactions, respectively. (D) Metascape Gene Ontology and KEGG enrichment analyses display the top 15 biological processes significantly enriched among dysregulated genes (E), LCN2 regulatory network, and its downstream effectors. This diagram illustrates the molecular mechanisms regulating LCN2 and its functional consequences in tumor progression. IL-6/JAK2/STAT3 signaling and NF-κB activation stimulate LCN2 transcription. PI3K/AKT signaling, influenced by LCN2, promotes cell survival. LCN2 stabilizes MMP9, promoting extracellular matrix (ECM) degradation and metastasis. RNA-seq data identified LCN2-regulated genes involved in proliferation and invasion (e.g., STAT1, TOP2A, CDCA7, ERBB2) and others with potential roles in immune modulation (e.g., NGFR, DLL4, LST1). Red and green arrows indicate upregulation and downregulation, respectively. Created in BioRender.

Similar articles

References

    1. Chippa V., Barazi H. StatPearls[Internet] StatPearls Publishing; Treasure Island, FL, USA: 2023. [(accessed on 31 January 2025)]. Inflammatory Breast Cancer. Available online: https://www.ncbi.nlm.nih.gov/books/NBK564324/ - PubMed
    1. De Schepper M., Nguyen H.-L., Richard F., Rosias L., Lerebours F., Vion R., Clatot F., Berghian A., Maetens M., Leduc S., et al. Treatment Response, Tumor Infiltrating Lymphocytes and Clinical Outcomes in Inflammatory Breast Cancer–Treated with Neoadjuvant Systemic Therapy. Cancer Res. Commun. 2024;4:186–199. doi: 10.1158/2767-9764.CRC-23-0285. - DOI - PMC - PubMed
    1. Wang X., Semba T., Thi L., Phi H., Chainitikun S., Iwase T., Lim B., Ueno N.T. Targeting Signaling Pathways in Inflammatory Breast Cancer. Cancers. 2020;12:2479. doi: 10.3390/cancers12092479. - DOI - PMC - PubMed
    1. National Cancer Institute Cancer Stat Facts: Female Breast Cancer. [(accessed on 28 March 2025)]; Available online: https://seer.cancer.gov/statfacts/html/breast.html.
    1. Mamouch F., Berrada N., Aoullay Z., El Khanousi B., Errihani H. Inflammatory Breast Cancer Disease: A Literature Review. Cancer Stud. 2019;2:129–135. doi: 10.31532/cancerstud.2.1.004. - DOI - PMC - PubMed

LinkOut - more resources