

Adaptive Curved Slicing for En Face Imaging in Optical Coherence Tomography
- PMID: 40732457
- PMCID: PMC12298316
- DOI: 10.3390/s25144329
Adaptive Curved Slicing for En Face Imaging in Optical Coherence Tomography
Abstract
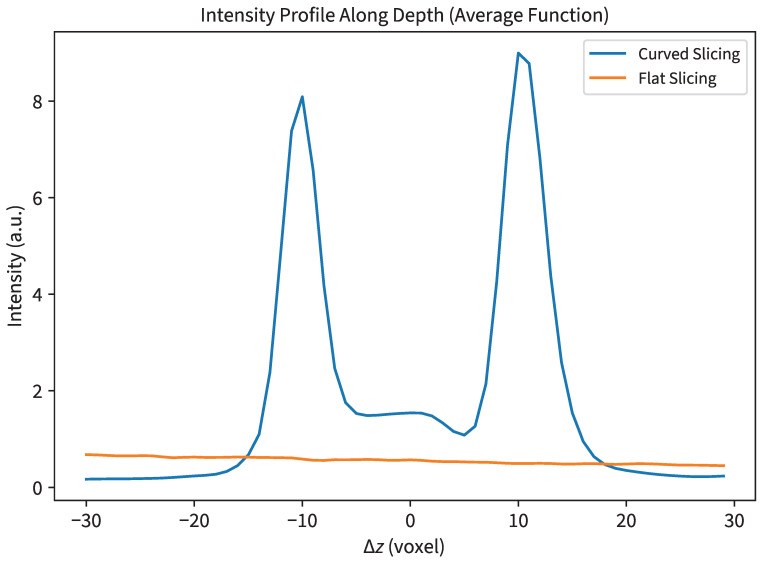
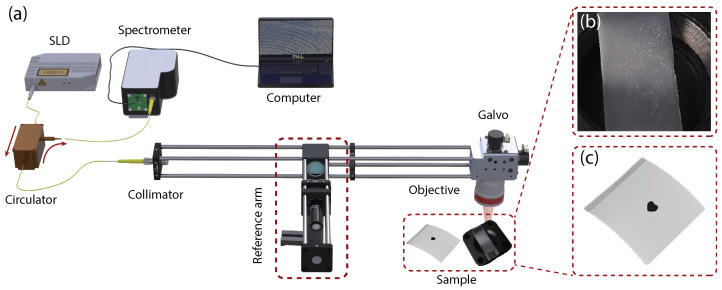
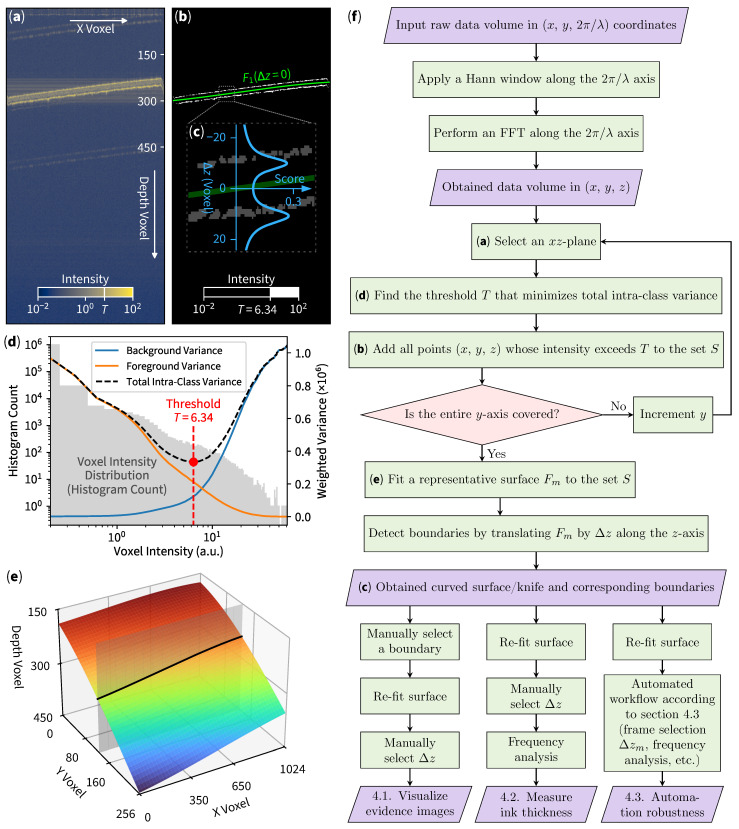
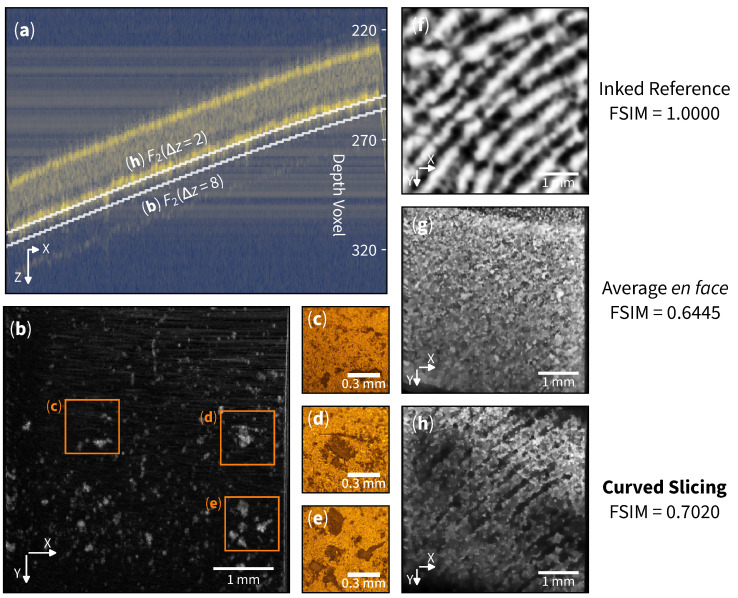
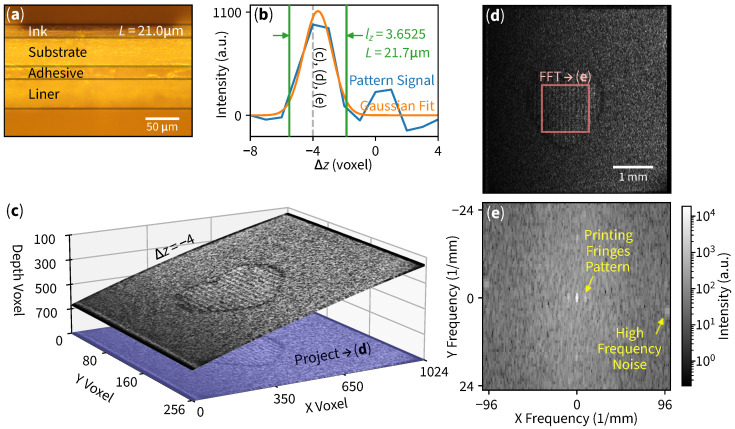
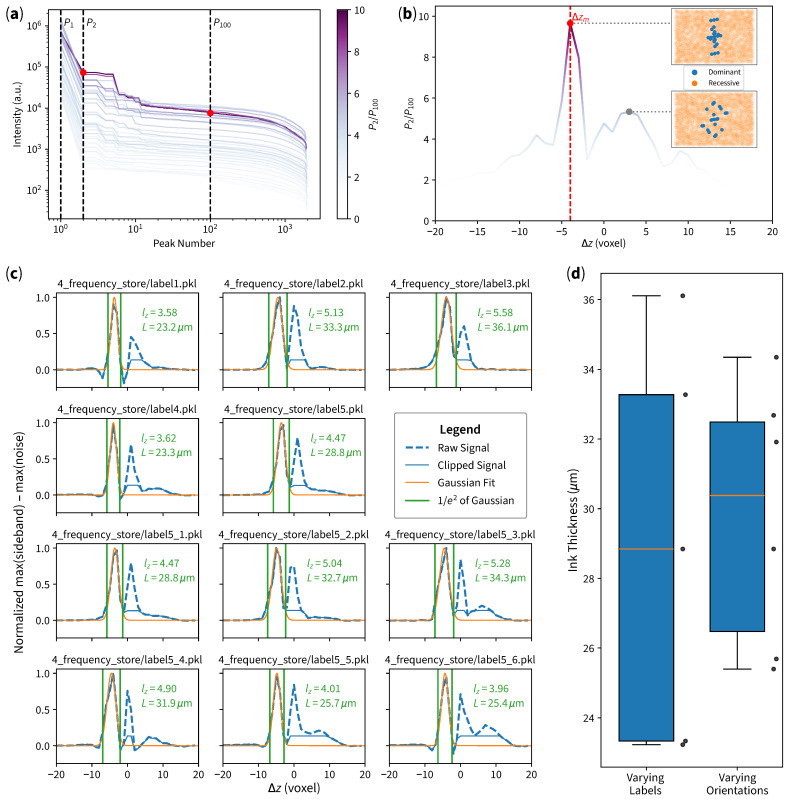
Optical coherence tomography (OCT) employs light to acquire high-resolution 3D images and is widely applied in fields such as ophthalmology and forensic science. A popular technique for visualizing the top view (en face) is to slice it with flat horizontal plane or apply statistical functions along the depth axis. However, when the target appears as a thin layer, strong reflections from other layers can interfere with the target, rendering the flat-plane approach ineffective. We apply Otsu-based thresholding to extract the object's foreground, then use least squares (with Tikhonov regularization) to fit a polynomial curve that describes the sample's structural morphology. The surface is then used to obtain the latent fingerprint image and its residues at different depths from a translucent tape, which cannot be analyzed using conventional en face OCT due to strong reflection from the diffusive surface, achieving FSIM of 0.7020 compared to traditional en face of 0.6445. The method is also compatible with other signal processing techniques, as demonstrated by a thermal-printed label ink thickness measurement confirmed by a microscopic image. Our approach empowers OCT to observe targets embedded in samples with arbitrary postures and morphology, and can be easily adapted to various optical imaging technologies.
Keywords: 3D metrology; functional sensing; image processing; optical coherence tomography; surface morphology fitting.
Conflict of interest statement
The authors declare no conflicts of interest.
Figures
Similar articles
-
Optical coherence tomography (OCT) for detection of macular oedema in patients with diabetic retinopathy.Cochrane Database Syst Rev. 2015 Jan 7;1(1):CD008081. doi: 10.1002/14651858.CD008081.pub3. Cochrane Database Syst Rev. 2015. PMID: 25564068 Free PMC article.
-
Optical coherence tomography (OCT) for detection of macular oedema in patients with diabetic retinopathy.Cochrane Database Syst Rev. 2011 Jul 6;(7):CD008081. doi: 10.1002/14651858.CD008081.pub2. Cochrane Database Syst Rev. 2011. Update in: Cochrane Database Syst Rev. 2015 Jan 07;1:CD008081. doi: 10.1002/14651858.CD008081.pub3. PMID: 21735421 Updated.
-
Sexual Harassment and Prevention Training.2024 Mar 29. In: StatPearls [Internet]. Treasure Island (FL): StatPearls Publishing; 2025 Jan–. 2024 Mar 29. In: StatPearls [Internet]. Treasure Island (FL): StatPearls Publishing; 2025 Jan–. PMID: 36508513 Free Books & Documents.
-
A New Measure of Quantified Social Health Is Associated With Levels of Discomfort, Capability, and Mental and General Health Among Patients Seeking Musculoskeletal Specialty Care.Clin Orthop Relat Res. 2025 Apr 1;483(4):647-663. doi: 10.1097/CORR.0000000000003394. Epub 2025 Feb 5. Clin Orthop Relat Res. 2025. PMID: 39915110
-
Management of urinary stones by experts in stone disease (ESD 2025).Arch Ital Urol Androl. 2025 Jun 30;97(2):14085. doi: 10.4081/aiua.2025.14085. Epub 2025 Jun 30. Arch Ital Urol Androl. 2025. PMID: 40583613 Review.
References
-
- Wu X., Gao W., He Y., Liu H. Quantitative measurement of subsurface damage with self-referenced spectral domain optical coherence tomography. Opt. Mater. Express. 2017;7:3919–3933. doi: 10.1364/OME.7.003919. - DOI
LinkOut - more resources
Full Text Sources
Research Materials
