Method for Extracting Arterial Pulse Waveforms from Interferometric Signals
- PMID: 40732516
- PMCID: PMC12300387
- DOI: 10.3390/s25144389
Method for Extracting Arterial Pulse Waveforms from Interferometric Signals
Abstract
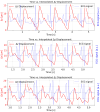
This paper presents a methodology for extracting and simulating arterial pulse waveform signals from Fabry-Perot interferometric measurements, emphasizing a practical approach for noninvasive cardiovascular assessment. A key novelty of this work is the presentation of a complete Python-based processing pipeline, which is made publicly available as open-source code on GitHub (git version 2.39.5). To the authors' knowledge, no such repository for demodulating these specific interferometric signals to obtain a raw arterial pulse waveform previously existed. The proposed system utilizes accessible Python-based preprocessing steps, including outlier removal, Butterworth high-pass filtering, and min-max normalization, designed for robust signal quality even in settings with common physiological artifacts. Key features such as the rate of change, the Hilbert transform of the rate of change (envelope), and detected extrema guide the signal reconstruction, offering a computationally efficient pathway to reveal its periodic and phase-dependent dynamics. Visual analyses highlight amplitude variations and residual noise sources, primarily attributed to sensor bandwidth limitations and interpolation methods, considerations critical for real-world deployment. Despite these practical challenges, the reconstructed arterial pulse waveform signals provide valuable insights into arterial motion, with the methodology's performance validated on measurements from three subjects against synchronized ECG recordings. This demonstrates the viability of Fabry-Perot sensors as a potentially cost-effective and readily implementable tool for noninvasive cardiovascular diagnostics. The results underscore the importance of precise yet practical signal processing techniques and pave the way for further improvements in interferometric sensing, bio-signal analysis, and their translation into clinical practice.
Keywords: Fabry–Perot interferometer; Python-based processing; arterial pulse waveform.
Conflict of interest statement
The authors declare no conflicts of interest. The funders had no role in the design of the study; in the collection, analyses, or interpretation of data; in the writing of the manuscript; or in the decision to publish the results.
Figures


References
-
- Nirmalan M., Dark P.M. Broader applications of arterial pressure waveform analysis. Contin. Educ. Anaesth. Crit. Care Pain. 2014;14:285–290. doi: 10.1093/bjaceaccp/mkt078. - DOI
-
- Kil H.-J., Park J.-W. Carotid artery monitoring patch using a supercapacitive pressure sensor with piezoelectricity. Nano Energy. 2023;114:108636. doi: 10.1016/j.nanoen.2023.108636. - DOI
MeSH terms
Grants and funding
LinkOut - more resources
Full Text Sources

